Bridge Railing Design Requirements (2024)
Chapter: 2 Literature Review

CHAPTER 2
Literature Review
Scope
This review considered the state of the practice in the testing, design, and evaluation procedures for bridge rail systems. For this review, the current AASHTO LRFD BDS (AASHTO 2020a) was considered to be the state of the practice; research in the roadside safety community not included in the current AASHTO LRFD BDS is considered to be the state of the art. Research efforts identified in this review include but are not limited to (1) full-scale crash tests demonstrating MASH-compliant systems, (2) guidelines and alternative methods for the design of bridge rail systems, and (3) guidelines and alternative methods for the design of bridge deck overhangs. Priority is placed on domestic literature, with particular emphasis on NCHRP reports, NCHRP projects, and literature published in the Transportation Research Record: Journal of the Transportation Research Board.
After the initiation of this research project, NCHRP Project 12-119, “MASH Railing Load Requirements for Bridge Deck Overhang” (Steelman et al. 2023) was initiated and completed to investigate bridge overhang design with AASHTO MASH test criteria. That work is reported separately and is not part of the literature review in this chapter.
Comparison of NCHRP Report 350 to MASH 2016 Criteria
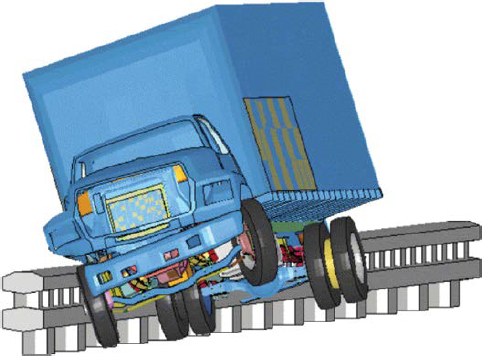
The conversion from NCHRP Report 350 (Ross et al. 1993) to MASH 2016 (AASHTO 2016) is accompanied by significant changes to vehicle characteristics and impact conditions. With the goal of representing the 85th percentile crash severity, the implementation of MASH 2016 is characterized by heavier vehicles, higher speeds, and more severe impact angles. While some barriers deemed acceptable under NCHRP Report 350 may be grandfathered into MASH compliance (Silvestri-Dobrovolny et al. 2017), some once-adequate barriers will fail to meet MASH standards. For example, the NCHRP Report 350-approved 32-in. New Jersey safety shape was found to be inadequate under MASH Test Level (TL)-4 conditions by researchers at the Midwest Roadside Safety Facility (MwRSF) in a full-scale crash test, as demonstrated in Figure 1 (Polivka et al. 2006). Subsequent testing of the same system at the Texas A&M Transportation Institute (TTI) substantiated this finding (Bullard et al. 2010).
Note that for longitudinal barriers, the differences between the first edition of MASH (AASHTO 2009b) and MASH 2016 (AASHTO 2016) criteria are minimal. No changes were made to the test conditions or vehicle dimensions. Changes were focused on vehicle damage documentation, particularly regarding floor pan and undercarriage photography. As such, any longitudinal system meeting MASH 2009 criteria meets MASH 2016 criteria.

Changes to Test Vehicles
To reflect the ever-changing fleet of vehicles in use on the road, revisions to crash-testing standards often include updates to vehicle characteristics. From the standards of NCHRP Report 350 (Ross et al. 1993) to those of MASH 2016 (AASHTO 2016), both the passenger car and pickup truck test vehicles saw marked increases in their test inertial weights and overall dimensions. Notable changes include a 57% increase in the weight of the small passenger car, a 13% increase in the weight of the pickup truck, and the removal of the center of mass height requirement for the passenger car. Changes to key dimensions for the small passenger car and pickup truck are presented in Table 1.
The conversion from NCHRP Report 350 to MASH 2016 also imposed significant changes on the single-unit truck (SUT) test vehicle. Most notably, the SUT increased in weight by 25%. Changes to key dimensions of the SUT test vehicle are shown in Table 2.
Table 1. Changes to nominal characteristics of small passenger car and pickup truck.
| Vehicle Type | Testing Standard | Test Vehicle | Weight (lb) | Dimensions | Center of Mass Location | |||
|---|---|---|---|---|---|---|---|---|
| Overall Length (in.) | Track Width (in.) | Front Overhang (in.) | Behind Front Axle (in.) | Above Ground (in.) | ||||
| Small Passenger Car | NCHRP Report 350 | 820C | 1,808 | 146 | 53 | 30 | 31 | 22 |
| MASH 2016 | 1100C | 2,420 | 169 | 56 | 35 | 39 | NA | |
| Pickup Truck | NCHRP Report 350 | 2000P | 4,410 | 211 | 65 | 31 | 55 | 28 |
| MASH 2016 | 2270P | 5,000 | 237 | 67 | 39 | 63 | 28 | |
NOTE: The 820C car from NCHRP Report 350 and the 1500A sedan from MASH 2016 are excluded from this table; NA = not applicable.
Table 2. Changes to nominal characteristics for SUTs and tractor-trailer vehicles.
| Vehicle Type | Testing Standard | Test Vehicle | Weight (lb) | Dimensions | Height of Ballast Center of Mass (in.) | ||
|---|---|---|---|---|---|---|---|
| Overall Length (in.) | Trailer Overhang (in.) | Bed Height (in.) | |||||
| Single-Unit Truck | NCHRP Report 350 | 8000S | 17,637 | 343 | NA | 51 | 67 |
| MASH 2016 | 10000S | 22,046 | 394 | NA | 49 | 63 | |
| Tractor-Van Trailer | NCHRP Report 350 | 36000V | 79,300 | 780 | 87 | 52 | 73 |
| MASH 2016 | 36000V | 79,300 | 780 | 87 | 50 | 73 | |
| Tractor-Tank Trailer | NCHRP Report 350 | 36000T | 79,300 | 780 | NA | NA | 81 |
| MASH 2016 | 36000T | 79,300 | 780 | NA | NA | 81 | |
NOTE: NA = not applicable.
Unlike the lighter vehicles, the characteristics of the tractor-van trailer and tractor-tank trailer were left unchanged in the conversion. However, under the standards of NCHRP Report 350, it was common practice to use loose material, such as sandbags or hay bales, as ballast. Although the standards recommended that the ballast be firmly secured to the floor of the cargo box, arresting these materials completely would be virtually impossible. Consequently, the motion of the ballast material within the cargo box could reduce the impact loads imposed on the barrier by increasing the time interval over which the vehicle’s change in momentum occurs. In MASH 2016, sandbags and hay bales are still considered acceptable, but more rigid ballast materials, such as metal or concrete blocks, are also proposed. In recent practice, the use of portable concrete barriers as ballast material is common. As such, while the weights of the articulated test vehicles have been left unchanged in the conversion, the impact forces associated with these vehicles require attention nonetheless and are discussed in Chapter 3.
Changes to Test Conditions
In addition to test vehicle modifications, the implementation of MASH 2016 is also accompanied by changes to the impact conditions of tests required for the evaluation of bridge rails. The nominal impact angle required in all small passenger car tests increased from 20 degrees to 25 degrees, and the nominal impact speed required in the SUT test increased from 50 mph to 56 mph. When combined with increases in vehicle weights, these changes resulted in nearly universal, significant increases in the impact severity of full-scale crash tests. The impact severity (IS) associated with a test is equal to the lateral component of the vehicle’s kinetic energy:
| (1) |
wherein m is the vehicle mass (slugs), v is the vehicle’s initial velocity (fps), and θ is the impact angle. This parameter is a key metric in the evaluation of a full-scale crash test, as it quantifies the lateral impact energy that must be accepted and redirected by the barrier. When evaluating the testing procedure from a designer’s perspective, the IS of an impact is roughly analogous to lateral impact force—higher IS values indicate higher lateral forces exerted on the barrier. Changes to the testing matrices relevant to bridge rail systems are collected in Table 3. Except for articulated vehicle tests 5-12 and 6-12, nominal IS values increased in all test designations.
Table 3. Comparison of NCHRP Report 350 to MASH 2016 test conditions for longitudinal barriers.
| Test Level | Test No. | Testing Standard | Test Vehicle | Vehicle Weight (lb) | Nominal Impact Conditions | |||
|---|---|---|---|---|---|---|---|---|
| Speed (mph) | Angle (degrees) | IS (kip-ft) | IS % Increase | |||||
| 1 | 1-10 | NCHRP Report 350 | 820C | 1,808 | 31 | 20 | 6.8 | — |
| MASH 2016 | 1100C | 2,420 | 31 | 25 | 13.9 | 104% | ||
| 1-11 | NCHRP Report 350 | 2000P | 4,410 | 31 | 25 | 25.3 | — | |
| MASH 2016 | 2270P | 5,000 | 31 | 25 | 28.7 | 13% | ||
| 2 | 2-10 | NCHRP Report 350 | 820C | 1,808 | 44 | 20 | 13.7 | — |
| MASH 2016 | 1100C | 2,420 | 44 | 25 | 28.0 | 104% | ||
| 2-11 | NCHRP Report 350 | 2000P | 4,410 | 44 | 25 | 51.0 | — | |
| MASH 2016 | 2270P | 5,000 | 44 | 25 | 57.8 | 13% | ||
| 3 | 3-10 | NCHRP Report 350 | 820C | 1,808 | 62 | 20 | 27.2 | — |
| MASH 2016 | 1100C | 2,420 | 62 | 25 | 55.5 | 104% | ||
| 3-11 | NCHRP Report 350 | 2000P | 4,410 | 62 | 25 | 101.2 | — | |
| MASH 2016 | 2270P | 5,000 | 62 | 25 | 114.8 | 13% | ||
| 4 | 4-10 | NCHRP Report 350 | 820C | 1,808 | 62 | 20 | 27.2 | — |
| MASH 2016 | 1100C | 2,420 | 62 | 25 | 55.5 | 104% | ||
| 4-11 | NCHRP Report 350 | 2000P | 4,410 | 62 | 25 | 101.2 | — | |
| MASH 2016 | 2270P | 5,000 | 62 | 25 | 114.8 | 13% | ||
| 4-12 | NCHRP Report 350 | 8000S | 17,637 | 50 | 15 | 98.7 | — | |
| MASH 2016 | 10000S | 22,046 | 56 | 15 | 154.8 | 57% | ||
| 5 | 5-10 | NCHRP Report 350 | 820C | 1,808 | 62 | 20 | 27.2 | — |
| MASH 2016 | 1100C | 2,420 | 62 | 25 | 55.5 | 104% | ||
| 5-11 | NCHRP Report 350 | 2000P | 4,410 | 62 | 25 | 101.2 | — | |
| MASH 2016 | 2270P | 5,000 | 62 | 25 | 114.8 | 13% | ||
| 5-12 | NCHRP Report 350 | 36000V | 79,300 | 50 | 15 | 443.9 | — | |
| MASH 2016 | 36000V | 79,300 | 50 | 15 | 443.9 | 0% | ||
| 6 | 6-10 | NCHRP Report 350 | 820C | 1,808 | 62 | 20 | 27.2 | — |
| MASH 2016 | 1100C | 2,420 | 62 | 25 | 55.5 | 104% | ||
| 6-11 | NCHRP Report 350 | 2000P | 4,410 | 62 | 25 | 101.2 | — | |
| MASH 2016 | 2270P | 5,000 | 62 | 25 | 114.8 | 13% | ||
| 6-12 | NCHRP Report 350 | 36000T | 79,300 | 50 | 15 | 443.9 | — | |
| MASH 2016 | 36000T | 79,300 | 50 | 15 | 443.9 | 0% | ||
NOTE: Cells with — have no data; the figures in these rows are the baseline values used to compare changes.
In small passenger car tests, IS increased by roughly 104%. In pickup truck tests, IS increased by 13%. In SUT tests, IS increased by 57%, increasing the nominal IS value for TL-4 bridge rails from 101.2 kip-ft to 154.8 kip-ft. As most bridge rails on major roadways are expected to meet TL-4 requirements, this increase in demand is particularly significant.
Impact Force Estimation Methods
The accurate estimation of impact demands is a key factor in the design of effective and efficient bridge rail systems. Low estimates may result in catastrophic structural failures or vehicle rollover events. Alternatively, high estimates may result in more expensive systems and overdesigned deck overhangs, imposing unnecessary stress on bridge owners’ budgets. Force estimates, then, provide an essential foundation for the design of any bridge rail system. However, the impact between a vehicle and a bridge rail system is an immensely complicated event. As a consequence of this intricacy, a wide variety of force estimation methods employing diverse philosophies and disparate levels of sophistication are currently used in practice. A singular, most accurate method has yet to be decided upon in the roadside safety community. The progression of impact force estimation methods, many of which still see use in contemporary applications, is demonstrated in the following sections.
Theoretical Methods
The oldest and lowest-resolution impact force estimation methods are those that attempt to idealize three-dimensional (3D) impact conditions and estimate the lateral impact force in a closed-form solution applicable to a two-dimensional (2D) space (a horizontal impact plane). As impact scenarios between vehicles and barrier systems are highly complicated, theoretical methods are likely the least accurate of the impact force estimation methods. However, they retain value for approximate validation of more complicated methods, are relatively simple to perform, and their use does not require specialized software or equipment. Unlike the more robust estimation methods, theoretical models cannot predict vertical impact forces.
Olson Method
In the early to mid-1900s, the bridge rail design process was largely performance-based, and detailed analyses were rare. The first rigorous mathematical model for estimating impact forces was proposed by Olson et al. (1970). By analyzing high-speed films of full-scale crash tests, the general behavior of an impacting vehicle was identified and modeled using basic principles of dynamics. The model relies on several assumptions necessary to represent the impact with closed-form solutions.
- Vehicle decelerations are constant throughout the impact scenario.
- Vertical and rotational vehicle accelerations are neglected.
- The lateral component of the vehicle velocity has been completely arrested at the instant the vehicle is parallel to the barrier.
- Vehicle snagging does not occur.
- Vehicle crush does not alter the location of the vehicle center of mass.
- The vehicle moves as a point mass with its entire mass collected at the vehicle centroid.
- Barrier flexibility may or may not be included in the model. Typically, concrete barriers are assumed to have zero flexibility.
- Tire-to-pavement friction forces are neglected.
- The barrier does not contain features with the propensity to produce significant abrupt vertical motion.
- With the application of these assumptions to the model, the average lateral impact force can be estimated. The idealized impact scenario is shown in Figure 2.

The lateral movement of the vehicle c.g. can be expressed as:
| (2) |
in which AL is the distance from the vehicle front end to the vehicle c.g. (ft), θ is the impact angle, B is one-half of the vehicle width (ft), and D is the lateral deflection of the barrier (ft). The time interval over which the vehicle becomes parallel to the system is estimated using the average lateral velocity (Vlat,avg), assuming the lateral velocity at parallel is equal to zero:
| (3) |
With the magnitude and time interval of the vehicle c.g. motion estimated, the average lateral deceleration of the vehicle can subsequently be estimated:
| (4) |
where Glat is average lateral vehicle deceleration (gs), alat is average lateral vehicle deceleration (ft/sec2), g is the acceleration due to gravity (ft/sec2), ∆Vlat is the change in lateral velocity (ft/sec), and g∆t is the time interval from impact to maximum lateral movement of the vehicle’s center of gravity.
From Equation 4, the average lateral and longitudinal impact forces can be estimated via basic principles of dynamics:
| (5) |
| (6) |
wherein W is the vehicle weight (kips), and μ is the estimated friction coefficient between the barrier and the vehicle. The frictional relationship between the lateral and longitudinal impact forces applies to all theoretical models presented herein.
Hirsch Modification to the Olson Method
In the wake of two 1976 bridge rail failures causing high-profile, multiple-fatality accidents, T.J. Hirsch developed a modification to the Olson method in 1978 (Hirsch 1978). Whereas the Olson method produced an estimate of the average lateral impact force, Hirsch sought an estimate for the maximum lateral impact force. To relate the average and peak lateral forces, Hirsch idealized the stiffness of both the vehicle and the barrier as a linear spring, resulting in a sinusoidal relationship between the impact force and the time after impact (Figure 3).
With this idealization, the relationship between the average lateral force estimated via the Olson method and the peak lateral force is obtained from trigonometric relationships.
| (7) |
Impulse-Momentum Method
The most recent impact force estimation method relying only on a theoretical model is the impulse-momentum method first proposed by Ritter et al. (1993). In this method, it is assumed that the collision between the vehicle and the barrier is perfectly elastic. As such, the lateral velocity is mirrored across the barrier during impact; the final lateral velocity is equal to the initial lateral velocity but in the opposite direction. The lateral impulse exerted during the collision is equal to the change in lateral vehicle momentum during impact
| (8) |
wherein ρf,lat and ρi,lat are the final and initial lateral vehicle momenta, respectively (slug-fps), mv is the vehicle mass (slugs), vf,lat is the final lateral velocity (fps), vi,lat is the initial lateral velocity, and θ is the impact angle. The time elapsed between vehicle impact and the point at which the vehicle is parallel to the system is estimated via the Olson method. As such, the magnitude of the impulse and the time over which it occurs can be estimated. If a triangular force pulse is assumed (Figure 4), the relationship between the impact duration and peak lateral force is
| (9) |
which, when rearranged, provides an estimate for the peak lateral force:
| (10) |


This method has seen use in multiple barrier design processes as a design load estimator (Ritter et al. 1993; Faller et al. 1996). Additionally, the method has been used to establish demand criteria to which an existing barrier system was evaluated (Loken et al. 2019). The results of this method can be obtained alternatively by increasing the dynamic factor of π/2 to 2 in Hirsch’s modification to the Olson method. Consequently, the impulse-momentum method will always provide the highest lateral impact force estimates of any theoretical model in the preceding discussion.
Computational Methods
Impact scenarios are characterized by a level of complexity that is virtually impossible to fully describe with simple mathematical relationships. Numerical methods, then, are far better suited to analyze vehicle impacts than theoretical methods. The finite element method has proven to be an invaluable tool in the design and analysis of roadside safety hardware under impact loading, though its use is often accompanied by extreme computational demands. For this reason, early computational methods employed low-resolution models with many simplifying assumptions. With the advancement of technology, however, high-fidelity modeling has not only become more practical but has come to define state-of-the-art methods in the roadside safety community.
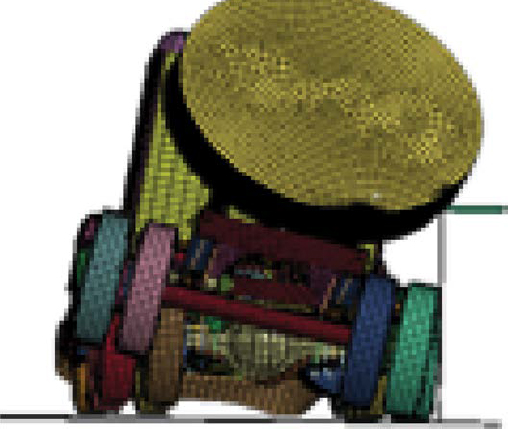
BARRIER-VII
BARRIER-VII is a rudimentary 2D finite element analysis software developed in the 1970s to aid in the design of roadside safety hardware (Powell 1973). The software performs calculations with low-fidelity models (represented in Figure 5) to simulate impact conditions. Although the manifest purpose of BARRIER-VII is to evaluate the performance of a barrier under impact conditions, impact force estimates can be extracted from the simulation as cumulative lateral barrier forces over the impact area. While it is not a common method of force estimation, this method was employed by Bloom et al. in 1974 as part of an FHWA project to establish bridge rail guidelines (Bloom et al. 1974). In this application, the impact forces acting on concrete barriers

LS-DYNA
LS-DYNA is an advanced simulation tool produced by Livermore Software Technology Corporation in Livermore, California (Hallquist 2007). With nonlinear dynamic capabilities, LS-DYNA has proven to be a valuable tool for analyzing vehicle impact scenarios (Figure 6). As computing power becomes less expensive and more readily available, LS-DYNA is used more and more frequently within roadside safety applications. Currently, LS-DYNA represents the state of the art in collision simulation technology.
LS-DYNA sees extensive use in both the design and evaluation of bridge rail systems. Through advanced simulation in LS-DYNA, a system’s performance can be predicted prior to full-scale crash testing, resulting in better-informed and more successful tests. Impact force estimates can be extracted from these collision simulations in two ways: (1) direct measurement of contact forces between vehicle parts and the barrier system and (2) calculation of forces exerted by the
vehicle from measurements of the vehicle’s lateral, longitudinal, and rotational accelerations. The former of these methods allows for not only an estimate of the impact force magnitude but of the application location and footprint as well. To reduce noise, both extraction methods are commonly smoothed with a 50-ms averaging filter.
Whereas theoretical models are limited to lateral and longitudinal impact force estimates, LS-DYNA is capable of estimating vertical impact forces as well, using one of the two methods previously described. Additionally, LS-DYNA simulations are capable of capturing the effect of tail-slap, which occurs when the box of an SUT or articulated vehicle strikes a barrier. Lateral impact forces associated with tail-slap are typically more severe than those exerted in the initial impact sequence (Bligh et al. 2017). As such, accounting for tail-slap is important when estimating impact forces exerted by SUTs and articulated vehicles.
Several contemporary barrier studies have implemented LS-DYNA in their methodologies. In a research effort to propose guidelines for barriers installed on mechanically stabilized earth (MSE) retaining walls and updates to barrier design loads, Bligh et al. (2017) used LS-DYNA simulations to estimate the impact forces of MASH TL-4 and TL-5 test vehicles on concrete barriers of varying heights. Similarly, Silvestri-Dobrovolny et al. (2017) determined MASH equivalency of bridge rails approved under NCHRP Report 350 using impact forces extracted from LS-DYNA simulations. In both studies, impact simulations were used to form updated impact force estimates associated with MASH test vehicles. In these applications, impact forces were measured directly from part contacts and processed with a 50-ms averaging filter.
Measurement Methods
Theoretical and computational models estimate impact forces based on the mechanics, assumptions, and predictions of virtual impact scenarios. Conversely, impact forces can also be estimated via data collected in full-scale crash tests. In a full-scale crash test, impact forces can be estimated via direct measurement with an instrumented wall or calculated from measurements of the vehicle accelerations during the impact sequence.
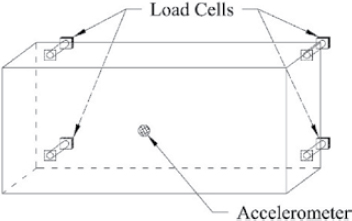
Instrumented Barrier
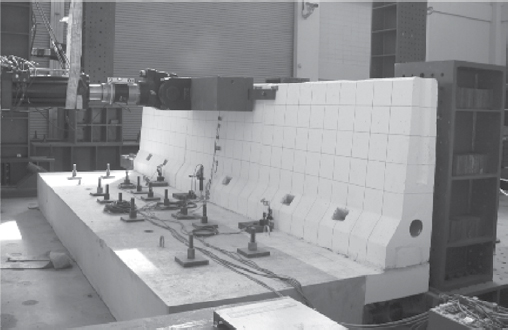
Impact forces can be measured in crash tests through the use of instrumented barriers. Barrier instrumentation types include load cells, accelerometers, and strain gages. In an instrumented wall test, load cells are installed on the nonimpact side of an impacted barrier to measure lateral impact forces exerted on the barrier. Additionally, instrumented walls are typically fastened with an accelerometer to account for inertial effects. A typical instrumented wall installation is shown in Figure 7.
Current design forces for bridge rails in AASHTO LRFD BDS were extracted from instrumented wall tests performed by Noel et al. (1981) and Beason et al. (1989). The studies featured
calibrated, instrumented concrete barriers subjected to a combined 18 full-scale crash tests of a variety of vehicles ranging from small passenger cars to a tractor-tank trailer. In both tests, results were passed through a 50-ms averaging filter to reduce data noise.
Instrumented walls represent a robust method of estimating impact forces. This method is capable of estimating a variety of pertinent impact conditions, such as impact force magnitudes, application heights, and vehicle-barrier contact area distributions. Additionally, instrumented wall tests are able to account for tail-slap effects. Instrumented wall tests, however, are expensive to perform and are typically unable to provide data on longitudinal or vertical impact forces. To expand the utility of instrumented wall test results, researchers derived relationships with which the results of an instrumented wall test could be extrapolated to other, noninstrumented crash tests. The relationship used to account for variations in conditions between tests, as described by Bligh et al. (2017), is demonstrated in Equation 11:
| (11) |
wherein Fi is the impact force, Vi is the impact velocity, θi is the impact angle, Li is the longitudinal distance from the front of the test vehicle to its c.g., Ki is the barrier contact area or stiffness, and Wi is the vehicle weight. Subscripts distinguish the impacts, with the parameters of the instrumented wall test denoted with subscript 1 and the impact with the desired conditions denoted with subscript 2.
Alternatively, impact forces can be measured indirectly through the use of strain gages. By securing strain gages to the reinforcing steel of a concrete barrier, impact forces can be calculated from deformations measured in the testing sequence.
Inertial Estimation
A more efficient, but less robust, alternative to the instrumented wall test is the vehicle-based inertial estimation method. Typically, in contemporary full-scale crash tests, an accelerometer is installed near the test vehicle’s c.g. to measure lateral, longitudinal, and vertical accelerations. Using the acceleration data from this instrument, rudimentary impact force estimates are derived from Newton’s second law of motion. However, due to the variation of mass, crush, and ballast character along the length of the vehicle, acceleration measurements may vary drastically at different locations within the vehicle. For this reason, if impact force estimates are to be derived from acceleration measurements, multiple accelerometers need to be installed along the vehicle length (Beason et al. 1989). As accelerations are sensitive to vehicle characteristics and mass distribution, the inertial estimation method differs between single-unit vehicles (like small passenger cars, pickup trucks, SUTs) and articulated, double-unit vehicles (like tractor trailers and tractor-tank trailers). To estimate the impact forces exerted by single-unit vehicles, Beason et al. (1989) installed two accelerometers along the vehicle length. The acceleration at the vehicle c.g. was linearly interpolated from the results of the two accelerometers. In the same study, articulated vehicles were treated as two single-unit vehicles connected by a hinge and analyzed in the same manner. For both vehicle types, impact force estimates derived via the inertial estimation method trended strongly with the impact forces measured by the instrumented wall used in the study.
A procedure for estimating impact forces using vehicle deceleration data is outlined by Eller and Reid (2007). In this method, the lateral and longitudinal coordinate system is transformed to coincide with that of the barrier using yaw measurements, and lateral impact forces are calculated accordingly using vehicle deceleration measurements.

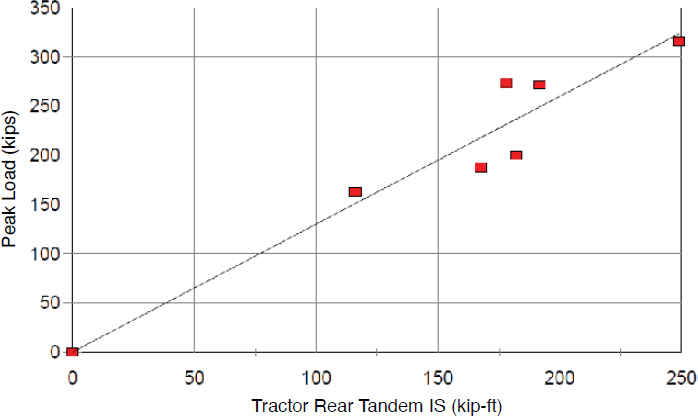
Linear Regression from Impact Severity
In a research effort to design a TL-5 F-shape barrier, researchers at MwRSF developed an alternative method of estimating vehicle impact forces (Faller et al. 2004). The alternative method correlates impact forces measured from vehicle inertia with measured impact severities using linear regression. To develop the relationship, estimated peak lateral loads were plotted against impact severity for six tractor-tank trailer crash tests performed at TTI. Plots of peak lateral loads versus total impact severity and rear tandem impact severity are shown in Figures 8 and 9, respectively.
The results of this study suggested that the relationship between impact severity and peak lateral impact load was roughly linear. The approximate linear increase of peak lateral impact load with respect to the total tractor-trailer impact severity was
| (12) |
where Ft was the peak lateral impact load (kips) and IStotal was the total impact severity of the tractor-tank trailer (kip-ft). Similarly, the approximate linear increase of peak lateral impact load with respect to the rear tandem impact severity was
| (13) |
where ISrear tandem was the impact severity of the rear tandem (kip-ft). Using the nominal MASH 2016 TL-5-12 impact severity of 443.9 kip-ft, the peak lateral force estimated using Equation 12 is 246 kips. To estimate the impact force using Equation 13, the research team first estimated the average weight carried by the rear tandem axle in a comparison of known measurements from crash-tested tractor-tank trailers. It was determined that the average rear tandem axle weight for the MASH tractor-tank trailer was 34,145 lb. Using this axle weight, the peak lateral force estimated using Equation 13 is 248 kips. In sum, this study estimates the nominal MASH TL-5 impact load at just under 250 kips.
AASHTO LRFD BDS Design Parameters
Design parameters currently recommended in AASHTO LRFD BDS have not been updated to reflect the more severe impact conditions of MASH. Additionally, advances in technology have allowed for a more confident estimation of these parameters. As such, several alternative design values have been proposed in the years following the implementation of MASH.
Existing AASHTO LRFD BDS Design Parameters
Current AASHTO LRFD BDS design loads for bridge rails are shown in Table 4. The current design loads were derived from the results of instrumented wall tests performed at TTI in the 1980s (Noel et al. 1981; Beason et al. 1989). Where necessary, dimensional analyses were performed to correct the instrumented wall measurements for changes in impact conditions and barrier height (Bligh et al. 2017). Minimum rail heights required for vehicle stability were determined via crash testing.
Contemporary Minimum Height Requirements
When a vehicle strikes a bridge rail system, an overturning moment proportional to the height discrepancy between the vehicle’s center of mass and the resultant force of the rail is produced. For the vehicle to remain stable, the height of the barrier must be sufficiently tall such that the
Table 4. Current AASHTO LRFD BDS design parameters for bridge rails.
| Design Parameter | Railing Test Level | |||||
|---|---|---|---|---|---|---|
| TL-1 | TL-2 | TL-3 | TL-4 | TL-5 | TL-6 | |
| Minimum Height of Rail, H (in.) | 27.0 | 27.0 | 27.0 | 32.0 | 42.0 | 90.0 |
| Lateral Force, Ft (kips) | 13.5 | 27.0 | 54.0 | 54.0 | 124.0 | 175.0 |
| Longitudinal Force, FL (kips) | 4.5 | 9.0 | 18.0 | 18.0 | 41.0 | 58.0 |
| Vertical Force, Fv (kips) | 4.5 | 4.5 | 4.5 | 18.0 | 80.0 | 80.0 |
| Distribution of Lateral Force, Lt (ft) | 4.0 | 4.0 | 4.0 | 3.5 | 8.0 | 8.0 |
| Distribution of Vertical Force, Lv (ft) | 18.0 | 18.0 | 18.0 | 18.0 | 40.0 | 40.0 |
| Height of Resultant Load, He (in.) | 18.0 | 20.0 | 24.0 | 32.0 | 42.0 | 56.0 |
weight of the vehicle can negate the overturning moment. The implementation of MASH was accompanied by near-universal increases to impact severities. Increases to vehicle speeds and weights result in more significant overturning moments exerted during impact, diminishing the validity of current height requirements. As such, in the years following the implementation of MASH, several studies have been performed to determine new height requirements. Additionally, full-scale crash tests performed under MASH test conditions can be used to verify existing or alternative height requirements.
TL-1 Minimum Height
Researchers at the MwRSF conducted a full-scale crash test on a timber bridge rail to MASH test designation no. 1-11 in 2009 (Rosenbaugh et al. 2009). The bridge rail was 19.75-in. tall, significantly shorter than the current TL-1 height requirement of 27 in., but it successfully redirected the 2270P pickup. The results of this test, shown in Figure 10, indicate that the current height requirement of 27 in. is sufficient for TL-1 systems.
TL-2 Minimum Height
In 2018, MwRSF conducted a full-scale crash test on a combination bridge rail to MASH test designation no. 2-11 (Bielenberg et al. 2020). The combination rail was 48-in. tall, with a 24-in. steel structure mounted on a 24-in. rigid concrete parapet. In the test, the 2270P vehicle maintained stability while contacting the upper rail only minimally, as shown in Figure 11. The 24-in. concrete parapet, then, was believed to be the primary contributor to the stability of the vehicle, suggesting that the current 27-in.-height requirement is sufficient for TL-2 systems.
In 2022, TTI conducted a full-scale MASH TL-2 crash test on a 20-in.-tall permanent low-profile barrier. This 20-in.-tall barrier met the performance criteria in MASH.
TL-3 Minimum Height
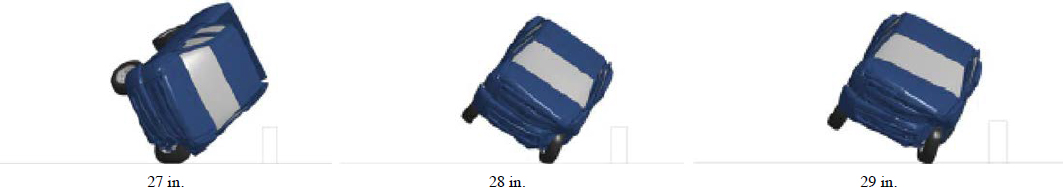
In 2017, research was conducted at TTI under NCHRP Project 20-07(395) to determine the MASH equivalency of NCHRP Report 350-approved bridge rail systems (Silvestri-Dobrovolny et al. 2017). After an analysis of full-scale crash tests failed to produce a confident TL-3 height requirement for MASH conditions, computer simulations were performed in LS-DYNA to estimate the minimum barrier height for vehicle stability. Simulations were conducted with a


vertical, rigid barrier at heights of 27 in., 28 in., and 29 in. impacted by the 2270P pickup. The critical roll scenario from each simulation is shown in Figure 12. The simulated crash test of the 27-in. barrier resulted in vehicle rollover. At a barrier height of 28 in., the vehicle did not experience rollover but was on the edge of instability. Confident stability was observed at a barrier height of 29 in.; the vehicle experienced some roll motion after impact but was stable throughout the test. The resulting minimum height recommendation for TL-3 systems, then, was 29 in.
Two full-scale crash tests were performed to MASH test designation 3-11 by MwRSF in 2018 on a 30-in.-tall timber rail (Schmidt et al. 2019). Both tests were successful, with the 2270P pickup experiencing minimal roll. The rail was backed by a tall, timber noise wall, but the test vehicle did not engage the noise wall; therefore, the 30-in. rail was deemed sufficient for maintaining stability. The maximum roll experienced by the vehicle in the two tests is shown in Figure 13.
TL-4 Minimum Height
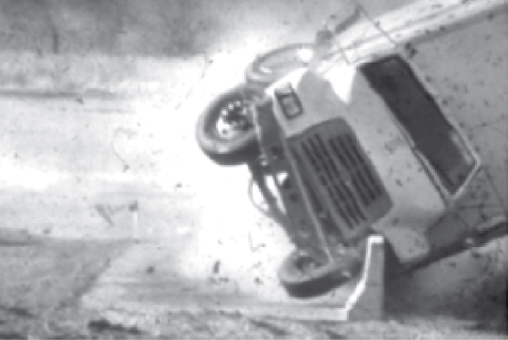
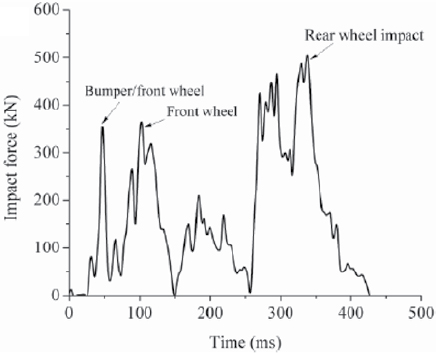
In 2006, as part of an effort to assess the effects of the proposed changes to impact conditions under MASH, MwRSF conducted a full-scale crash test according to MASH test designation no. 4-12 on a 32-in.-tall New Jersey safety shape barrier (Polivka et al. 2006). While the 32-in. test article was proven adequate for TL-4 conditions under NCHRP Report 350, it failed to successfully redirect the impacting vehicle. The SUT rolled over the barrier, as shown in Figure 14.

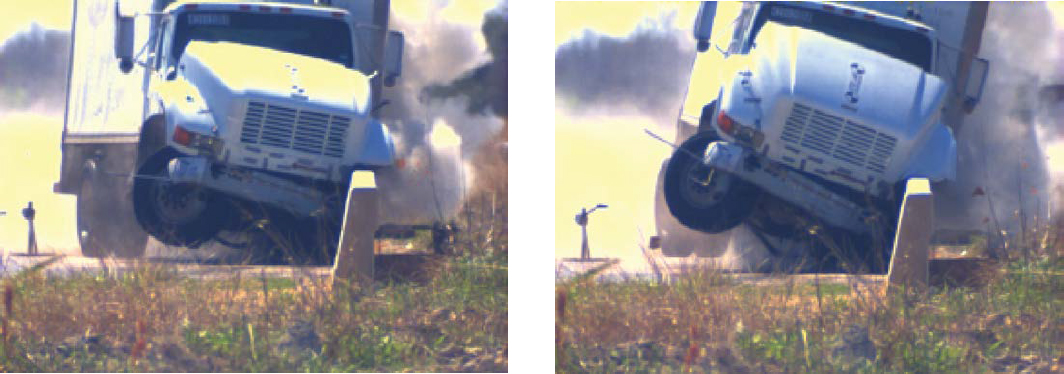
Under a similar study, TTI performed a full-scale crash test according to MASH test designation 4-12 on a 32-in. New Jersey safety shape bridge rail (Bullard et al. 2010). In this test, conducted in 2010, the SUT maintained stability, but researchers determined the vehicle would have rolled over the barrier had the test installation length been longer. The critical roll angle experienced by the test vehicle is shown in Figure 15. The results of the test, then, agreed with those of a similar test performed by MwRSF in 2006 (Polivka et al. 2006). The required height for stability in TL-4 impacts is greater than 32 in.
With the 32-in. height deemed insufficient, multiple studies were performed to establish an alternative minimum height for TL-4 barriers. In 2011, researchers at TTI conducted a parametric simulation study using LS-DYNA to investigate the effect of barrier height on vehicle stability (Sheikh et al. 2011). Rigid, single-slope barriers of varying heights were impacted in a series of simulated tests conforming to MASH test designation 4-12. Beginning with a barrier

height of 42 in., the height was incrementally reduced until a critical roll scenario was achieved at a barrier height of 36 in., as shown in Figure 16. As a result of the study, a minimum height requirement of 36 in. was proposed.
To investigate the proposed height requirement, a full-scale crash test conforming to MASH test designation no. 4-12 was performed on a 36-in. single-slope barrier. The results of the test were consistent with the simulation study; the SUT maintained stability throughout the test, as shown in Figure 17. In summary, this study established a crash-tested minimum TL-4 barrier height of 36 in. required to maintain SUT stability.

In 2012, an LS-DYNA computer simulation study was performed at MwRSF to determine the critical height for TL-4 barriers (Rosenbaugh et al. 2012). By varying the height of a vertical, rigid barrier and accounting for a critical vehicle damage mode, the required barrier height was determined to be 34.5 in. The successful simulations with maintained SUT stability are shown in Figure 18. This barrier height has not been confirmed in full-scale crash testing.
Multiple 36-in. barriers have been successfully crash tested to MASH TL-4 criteria since the proposal of the alternative minimum barrier height. MwRSF conducted a successful MASH test designation no. 4-12 crash test on a 36-in.-tall single-slope concrete barrier (Rosenbaugh 2019). In the same year, TTI performed a successful MASH 4-12 crash test on a 36-in.-vertical concrete


barrier (Bligh et al. 2018). Successful MASH TL-4 tests on 36-in. concrete barriers are shown in Figure 19.
Additionally, the 36-in. minimum height has been evaluated for metal post-and-beam systems. In 2019, MwRSF conducted full-scale crash tests according to MASH test designation nos. 4-10, 4-11, and 4-12 on a 36-in. steel tube bridge rail (Pena et al. 2019). All tests were successful, further substantiating the sufficiency of 36-in.-tall barriers to contain and redirect vehicles under TL-4 impact conditions. The results of MASH test no. 4-12 performed in the MwRSF study are shown in Figure 20.
TL-5 Minimum Height
Neither vehicle dimensions nor impact conditions were changed in the conversion from NCHRP Report 350 to MASH. As such, it is believed by researchers at MwRSF that the existing TL-5 minimum barrier height of 42 in. remains sufficient for MASH conditions (Stolle et al. 2022). In a MASH-equivalency study, researchers at TTI evaluated TL-5 barriers using this height requirement (Silvestri-Dobrovolny et al. 2017). Additionally, several successful MASH TL-5 crash tests have been performed on barriers with heights less than or equal to 42 in. These tests, which are summarized in Table 5, suggest that the existing height requirement is adequate for MASH TL-5 conditions.

Table 5. Summary of successful crash tests with 42-in. height to MASH test designation no. 5-12.
| Testing Organization | Year | Barrier Type | Barrier Height (in.) | Result |
|---|---|---|---|---|
| MwRSF (Faller et al. 2004) | 2005 | Open concrete bridge rail | 42.0 | Success |
| MwRSF (Rosenbaugh et al. 2007) | 2007 | Vertical concrete median barrier | 42.0 | Success |
| TTI (Buth and Menges 2011) | 2011 | Concrete safety shape bridge rail | 41.3 | Success |
| TTI (Sheikh et al. 2016) | 2016 | Metal post-and-beam | 42.0 | Success |
| TTI (Williams, Bligh, et al. 2015) | 2018 | Open concrete bridge rail | 42.0 | Success |
TL-6 Minimum Height
Currently, only two full-scale crash tests have been performed to NCHRP Report 350 test designation no. 6-12, both of which featured a 90-in.-tall barrier shown in Figure 21. (Beason et al. 1989; Hirsch and Fairbanks 1984). TL-6 impact conditions did not change in the conversion from NCHRP Report 350 to MASH, and no full-scale tests have been conducted since the adoption of MASH criteria.
In 2018, an LS-DYNA computer simulation study was performed to estimate the required height for MASH TL-6 barriers (Whitfield 2018). The results of the study suggested that a 62-in. vertical wall could be adequate to prevent a TL-6 tractor-tank trailer from rolling over during impact. The maximum roll of the vehicle in the simulation is shown in Figure 22. The findings of this study have not been confirmed through full-scale crash testing.
Contemporary Design Force Estimates
Contemporary research suggests that the current AASHTO design loads for bridge rails require modification. Uncertainties in the efficacy of current design loads stem from a variety of sources.

Primarily, in the conversion from NCHRP Report 350 to MASH 2016, vehicle characteristics and impact conditions were modified, resulting in greater impact severities, suggesting potential impact force increases. Additionally, current design loads for TL-4 and TL-5 bridge rails were established from crash tests in which the ballast mass was not rigidly secured to the vehicle, potentially resulting in uncharacteristically low impact force estimates (Bligh et al. 2017). As a consequence of the ballast conditions, the impact loads of TL-5 vehicles could require modification despite their weights remaining unchanged in the conversion to MASH. Last, advances in technology have provided insight into impact behavior not available at the formation of the current AASHTO design forces, such as the engagement of trailer boxes and the height at which loads are applied.
TL-3 Design Loads
Using finite element simulations in LS-DYNA, Silvestri-Dobrovolny et al. (2017) estimated TL-3 impact loads as part of a MASH-equivalency study for barriers approved under NCHRP Report 350. A TL-3 impact load estimate of 71 kips exerted at a height of 19 in. was extracted from a simulation in which a MASH 2270P test vehicle impacted a rigid, vertical parapet at 62 mph and at a 25-degree impact angle. The results of this study are listed in Table 9, which summarizes results for TL-3 through TL-6.
Alternatively, if Equation 11 is used to extrapolate instrumented wall loads to the impact conditions of MASH, an estimated TL-3 design load of 52 kips is achieved (Bullard et al. 2010). This extrapolated estimate is also shown in Table 9.
TL-4 and TL-5 Design Loads
Similarly, Bligh et al. (2017) estimated TL-4 and TL-5 impact loads using LS-DYNA simulations. Simulations of SUT and tractor-trailer impacts with rigid barriers of varying heights were performed from which lateral impact loads and their application heights were extracted. Due to the relationship between the barrier height and the interaction between the cargo box and the barrier, impact forces were found to vary significantly with the barrier height. For a relatively short barrier, the floor of the trailer clears the top of the barrier. As a result, the lateral impact

force is significantly reduced, and the vertical force is increased as the vehicle leans on the barrier to remain stable. With increasing barrier height, greater portions of the trailer impact load are exerted laterally onto the barrier, and the vertical force is reduced. The relationship between barrier height and impact behavior is depicted in Figure 23.
The variation of impact loads with respect to barrier height is shown in Tables 6 and 7 for TL-4 and TL-5, respectively. Variations are also demonstrated in Figures 24 and 25. Due to the variation of impact forces with respect to barrier height, Bligh et al. recommended the division of TL-4 and TL-5 into subcategories based on the height of the barrier. Proposed subcategories TL-4-1 and TL-5-1 correspond to the minimum height required for vehicle stability for TL-4 and TL-5, respectively. Subcategories TL-4-2 and TL-5-2 correspond to TL-4 and TL-5 barriers
Table 6. TL-4 impact force variation with barrier heights (Bligh et al. 2017).
| Design Parameter | Barrier Height (in.) | |||
|---|---|---|---|---|
| 36 | 39 | 42 | Tall | |
| Ft Transverse (kips) | 67.2 | 72.3 | 79.1 | 93.3 |
| FL Longitudinal (kips) | 21.6 | 23.6 | 26.8 | 27.5 |
| Fv Vertical (kips) | 37.8 | 32.7 | 22.0 | — |
| Lt or LL (ft) | 4 | 5 | 5 | 14 |
| He (in.) | 25.1 | 28.7 | 30.2 | 45.5 |
NOTE: Ft = transverse force; FL = longitudinal force; FV = vertical force; Lt = distribution length of transverse force; LL = distribution length of longitudinal force; He = height of transverse and longitudinal loads.
Table 7. TL-5 Impact force variation with barrier height (Bligh et al. 2017).
| Design Parameter | Barrier Height (in.) | |||
|---|---|---|---|---|
| 42 | 48 | 54 | Tall | |
| Ft Transverse (kips) (First Impact) | 54.6 | 51.7 | 53.8 | 53.7 |
| Ft Transverse (kips) (Second Impact) | 123.0 | 261.8 | 263.5 | 270.4 |
| Ft Transverse (kips) (Third Impact) | 159.0 | 232.8 | 295.5 | 316.6 |
| FL Longitudinal (kips) | 73.5 | 74.6 | 77.2 | 72.6 |
| Fv Vertical (kips) | 160.0 | 108.0 | 62.8 | — |
| Lt or LL (ft) | 10.0 | 10.0 | 10.0 | 10.0 |
| He (in.) | 34.3 | 42.9 | 46.6 | 51.7 |
NOTE: — = not applicable.

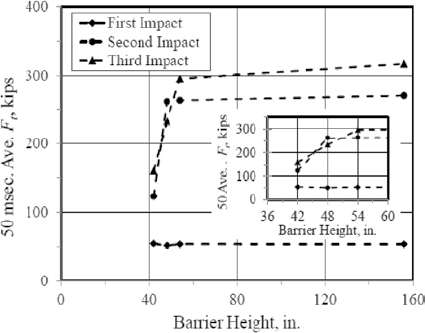

taller than the minimum required height for vehicle stability, respectively. The final design parameters proposed in this study are collected in Table 9. The estimates produced in these rigid wall simulation studies are considered to be conservative, as they correspond to simulated impacts with rigid parapets. In reality, any impacted barrier will deform, if only slightly, decreasing the sustained impact force.
Most recently, Cao et al. (2019) performed high-fidelity finite element simulations in LS-DYNA to investigate the impact behavior of solid parapet barriers. Simulations were conducted with a single-slope TL-4 barrier and a safety-shaped TL-5 barrier impacted by an SUT model revised to represent MASH conditions and a 36000V tractor-trailer model, respectively. These impact simulations are depicted in Figure 26.
The progression of the simulated TL-4 test is shown in Figure 27. The corresponding filtered impact force response is shown in Figure 28. The maximum lateral force measured in the simulation was roughly 112 kips, significantly higher than the impact forces measured in the rigid wall tests performed by Bligh et al. in 2017.

Likewise, the progression of the simulated TL-5 test is shown in Figure 29. The corresponding, filtered impact force response is shown in Figure 30. The maximum lateral force measured in the simulation was roughly 415 kips. Similar to the simulated TL-4 test, this maximum force was remarkably higher than the impact forces measured by Bligh et al. in 2017.
Cao et al. also investigated the height at which lateral forces were exerted in the simulated impacts. Impact heights varied significantly between the three characteristic phases of impact and between the TL-4 and TL-5 vehicles. Most notably, the third, and most severe, impact phase for the TL-4 SUT was found to exert forces significantly lower than the height of the barrier. Conversely, the third impact phase for the TL-5 tractor trailer was found to exert forces across the entire height of the barrier. Detailed impact height distributions are shown in Table 8.


TL-4 impact loads were also estimated using instrumented wall extrapolation per Equation 11 (Bullard et al. 2010). These estimates are shown alongside LS-DYNA estimates in Table 9.
TL-6 Design Loads
Full-scale crash testing of TL-6 systems is rare. As of 2019, only two full-scale crash tests of tractor-tanker vehicles have been performed, neither of which were under MASH criteria. In the instrumented wall test from which the current AASHTO LRFD BDS design loads were extracted, a 90-in.-vertical barrier was impacted by an 80,000-lb tractor tanker (Beason et al. 1989). In this test, a peak dynamic tail-slap load of 408 kips acting at a height of 56 in. was measured by the instrumented wall. On-board accelerometers corroborated this data. The product of the peak tail-slap acceleration and the participating trailer mass was roughly 400 kips. Additionally, in another test, a 90-in. “Roman wall” concrete barrier successfully redirected a tractor tanker (Hirsch and Fairbanks 1984). The barrier impacted in this test was designed assuming two applied loads: a 60-kip load applied at 21 in. corresponding to the weight of the trailer and a 144-kip load applied at 84 in. corresponding to the ballast weight. Both forces were derived from extensive assumptions of the vehicle’s mass distribution and impact behavior.
As part of a research effort to design a cost-effective TL-6 barrier, researchers at the MwRSF elected to use a 350-kip design load for a rigid barrier impact (Whitfield 2018). In the study, the lower-bound strength of the successfully tested Roman wall barrier was estimated via traditional yield-line analysis to be 350 kips. In the full-scale crash test of that barrier, minimal damage was
Table 8. Impact force height distribution (Cao et al. 2019).
| Vehicle | Barrier Height (in.) | Height Range for Impact Force Application (in.) (Percentage of Total Barrier Height) |
||
|---|---|---|---|---|
| First Impact | Second Impact | Third Impact | ||
| SUT | 36 | 18–23 (50–64%) | 20–26 (56–72%) | 5–17 (14–47%) |
| Tractor Trailer | 42 | 20–25 (48-60%) | 2–14 (5–33%) | 2-42 (5–100%) |
Table 9. Alternative AASHTO LRFD BDS design values for TL-3 through TL-6.
| Design Parameter | Railing Test Level | |||||
|---|---|---|---|---|---|---|
| TL-3a | TL-4-1b | TL-4-2 | TL-5-1 | TL-5-2 | TL-6 | |
| Bridge Rail Height, H (in.) | ≥ 29 | 36 | > 36 | 42 | > 42 | —c |
| Lateral Force, Ft (kips) | 71 52d |
70 76d 112f |
80 76d 112f |
160 415f |
260 415f |
350e 408g |
| Longitudinal Force, FL (kips) | — | 22 | 27 | 75 | 75 | — |
| Vertical Force, Fv (kips) | — | 38 | 33 | 160 | 108 | — |
| Distribution of Lateral Force, LL (ft) | — | 4 | 5 | 10 | 10 | — |
| Distribution of Vertical Force, Lv (ft) | — | 18 | 18 | 40 | 40 | — |
| Height of Resultant Load, He (in.) | 19 | 25 | 30 | 34 | 43h | — |
aTL-3 parameters extracted from NCHRP Project 20-07(395) (Silvestri-Dobrovolny et al. 2017) unless noted.
bTL-4 parameters extracted from NCHRP Web-Only Document 326 (Bligh et al. 2017) unless noted.
cDashes indicate parameters without alternative proposed values.
dSecondary TL-3 and TL-4 design loads extracted from NCHRP Web-Only Document 157 (Bullard et al. 2010).
eTL-6 design load extracted from TL-6 barrier design study (Whitfield 2018).
fExtracted from finite element simulations (Cao et al. 2019).
gPeak dynamic load extracted from instrumented wall study with TL-6 test vehicle (Beason et al. 1989).
hIf barrier height exceeds 54 in., use He = 52 in.
observed. As such, the researchers hypothesized that the lateral load exerted by the tractor tanker was no greater than 350 kips.
In the same study, a series of simulations was performed in LS-DYNA in which a tractor-tank trailer impacted a rigid wall of varying heights at 50 mph and at an impact angle of 15 degrees. In agreement with the findings of similar TL-4 and TL-5 simulations, lateral impact forces were found to increase with increasing barrier height. Maximum impact forces of 136, 159, 168, and 160 kips were imparted to barriers with heights of 50, 62, 70, and 90 in., respectively. However, these impact forces were not used as design forces in the study, as the goal of the simulation effort was to determine the minimum TL-6 barrier height, rather than the design load.
Alternative Design Parameters
Design parameter alternatives extracted from contemporary research are presented in Table 9. Studies in which parameters were proposed are denoted with superscripts. Parameters with no recommended modifications are indicated by dashes.
Design and Analysis of Bridge Rail Systems
Bridge rail systems protect drivers from the dangerous conditions of elevated roadways. To ensure the safety of passengers in an errant vehicle, a bridge rail must have a structural capacity sufficient to resist the forces exerted by the vehicle during the impact sequence and contain the vehicle. As such, structural adequacy is a crucial design consideration for any bridge rail. Structural failure of a bridge rail system is likely to result in a fatal accident.
Bridge rail systems are highly diverse. A variety of materials, shapes, and features make up the current portfolio of in-use systems. In general, bridge rail systems can be categorized as concrete,
metal post-and-beam, combination, flexible, or timber. Additional specializations can be added to any system, such as curbs, pedestrian railings, or retaining walls. In this section, the existing philosophy of AASHTO LRFD BDS Section 13 is presented alongside summaries of relevant, contemporary research for the entire landscape of bridge rail systems.
Concrete Bridge Rails
Concrete barriers are the most common type of safety hardware found on bridges and can be categorized as either solid concrete parapets or open concrete rails, as shown in Figure 31. Design philosophies and analysis procedures differ between these bridge rail systems.
Solid concrete parapets are continuous slabs of reinforced concrete often featuring a specialized face shape to influence impact behavior. Typical solid concrete parapets include the New Jersey safety shape, the F-shape, the single-slope, and the vertical wall. Alternatively, open concrete rails are post-and-beam systems composed of a continuous concrete beam secured to concrete posts extending from the deck. Due to their frequency of use, extensive research has been conducted on concrete bridge rails since the formulation of the current AASHTO design philosophy.
Existing AASHTO LRFD BDS Philosophy
Solid concrete parapets and open concrete rails require different design and analysis methods. As such, AASHTO provides separate guidance for each type of concrete barrier.
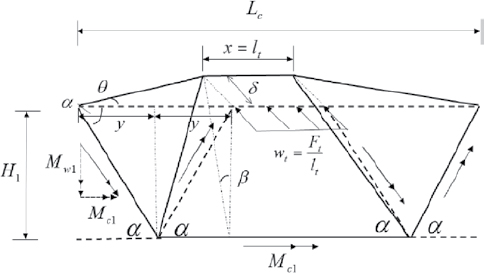
Solid Concrete Parapets
The current AASHTO design procedure for solid concrete parapets employs a yield-line analysis method proposed by Hirsch (1978). The method is founded in an assumed v-notch failure mechanism about the impact location, as shown in Figure 32. Rigid, triangular plates rotate about lines of yielded steel to produce the failure pattern. To determine the capacity of the barrier, an energy balance is performed with a virtual displacement, Δ, applied at the top of


the parapet. External work due to the applied force, Ft, is equated to the internal work done by the rotation of the rigid plates about the yield lines:
| (14) |
where Mi is the flexural strength of the parapet about a particular yield line, and θi is the corresponding rotation about that yield line.
Manipulating this relationship to reflect the flexural strength of the parapet about its longitudinal and vertical axes produces the current AASHTO design equation for a continuous, solid concrete parapet:
| (15) |
in which the result, Rw, is the critical load applied at the top of the parapet at which the parapet will experience the yield-line failure mechanism; Lt is the longitudinal distribution length of the impact force (ft); Mw is the flexural resistance of the parapet about its vertical axis (k-ft); Mb is the additional flexural resistance of a beam component (k-ft), if any; Mc is the flexural resistance of the parapet about its longitudinal axis (k-ft/ft); H is the height of the parapet (ft); and Lc is the critical length of the yield-line pattern (ft). The critical length is determined as the length of the yield-line pattern, which minimizes the resistance of the barrier:
| (16) |
The result of Equation 15, Rw, is depicted in Figure 32.
An additional yield-line mechanism is possible at locations of parapet discontinuities, such as parapet terminals or untreated expansion joints. In this alternative failure mechanism, one rigid plate rotates about one yield-line extending outward from the parapet base at the free edge, as shown in Figure 33. By applying an energy balance to the alternative yield-line mechanism, the current AASHTO design equations for solid concrete parapet free ends are produced.
| (17) |
| (18) |
Open Concrete Rails
Open concrete rails may be favored over solid barriers for aesthetic considerations or in scenarios where vented water flow is required in the event of an overtopping flood. Currently, AASHTO recommends open concrete rails be designed in a different manner than the yield-line method used for solid parapets. In the yield-line method for solid parapets, the flexural strength of the concrete is used to determine the critical length of the failure mechanism. Alternatively, for concrete post-and-beam systems, the flexural strengths of the posts about the longitudinal axis and of the beam about the vertical axis are used to determine the critical number of railing spans participating in failure and, consequently, the lateral resistance of the barrier. For reference, single-, two-, and three-span failure modes are shown in Figure 34. It should be noted that the illustration in Figure 34 is specific to metal post-and-beam systems. Mp in Figure 34 is analogous to the flexural resistance of the concrete beam about the vertical axis, Mb.
For interior failure modes involving an odd number of railing spans, N, Equation 19 applies.
| (19) |
Whereas for interior failure modes involving an even number of railing spans, Equation 20 applies
| (20) |


in which L is the post spacing (ft), Mb is the flexural resistance of the beam about the vertical axis (k-ft), and Pp is the shear force on a single post (kips), which is equal to
| (21) |
where Mc,post is the flexural resistance of a single post about the longitudinal axis (k-ft) and is the height of the barrier resultant force (ft). Due to the rigidity of concrete barrier systems, the height of the resultant barrier force is considered to be equal to the height of the barrier.
To determine the resistance of an interior span, Equations 19 and 20 are evaluated for increasing values of N until the minimum value of R is identified. For end segments, the resistance of the barrier is calculated in Equation 22.
| (22) |
GFRP-Reinforced Concrete Rails
Glass fiber-reinforced polymer (GFRP) reinforcement is becoming increasingly common in practice, but GFRP-reinforced parapets are not yet currently addressed in AASHTO LRFD BDS Section 13 guidance. AASHTO issued the first LRFD Bridge Design Guide Specification for
GFRP-Reinforced Concrete Bridge Decks and Traffic Railings in 2009 (AASHTO 2009a), followed by a 2nd edition, LRFD Bridge Design Guide Specification for GFRP-Reinforced Concrete with “Bridge Decks and Traffic Railings” removed from the title (AASHTO 2018). In 2020, a revised 2nd edition was published with errata (AASHTO 2020b). Due to the brittle nature of GFRP compared to steel, yield-line approaches cannot be applied in the design of GFRP-reinforced bridge rails. The 2nd edition Guide Specification notes that inelastic methods are permitted for GFRP-reinforced concrete railings, but “equilibrium of forces and compatibility of deformations shall be explicitly accounted for by implementing suitable analytical or numerical methods.” A post-and-beam design methodology is provided in Appendix A5 of the 2nd edition Guide Specification, which appears similar to the method found in Appendix A13 of the AASHTO LRFD BDS and is similarly termed an “inelastic” method. However, the provision requiring that compatibility is enforced together with equilibrium requires an additional layer of rigor compared to metal post-and-beam inelastic analyses, which is necessary to ensure adequate safety when large strains are anticipated in GFRP. Resistance factors for flexure with sections controlled by high GFRP strains are dependent on the GFRP strain and can fall as low as 0.55 according to the 2nd edition Guide Specification.
State of the Art
Due to the frequency with which concrete rails are implemented on bridges, many research efforts have been conducted regarding their analysis and design. These efforts have been focused primarily on solid concrete parapets, though guidance does exist for open concrete rails that is not currently found in AASHTO LRFD BDS.
Steel-Reinforced Solid Concrete Parapets
Since the formulation of the current AASHTO LRFD BDS guidance on solid concrete parapet design, advances in computer simulation and a large number of crash tests have brought the accuracy of the current methodology into question. The current, v-shaped yield-line mechanism, for example, is rarely observed in full-scale crash tests involving solid concrete parapets. Based on impact force estimates, damage to solid concrete parapets designed according to current guidance is generally less severe than would be expected, indicating significant reserve capacity not accounted for in the current methodology. Recent research has posed three possible explanations for the current misrepresentation of parapet strength: (1) the actual yield-line pattern differs from the pattern presented in AASHTO LRFD BDS, (2) deformation and inertial activation of the barrier results in higher capacity, and (3) the lateral load should be applied at a height more representative of actual impacts, rather than at the top of the barrier. These explanations are discussed herein. Additionally, current AASHTO LRFD BDS guidance suggests that the failure of a parapet barrier will be governed by flexure. Conversely, recent research indicates that, in some cases, punching shear strength may govern the strength of the barrier.
Modified Yield-Line Pattern
A series of experimental studies on the failure mechanisms of parapet barriers performed in 2004 was the first to explicitly suggest an alternative yield-line mechanism (Korea Highway Corporation 2004; Woo et al. 2004; Kang et al. 2004). With these studies as a foundation, Jeon et al. (2008) conducted static loading tests on the standard Korean barrier shape to investigate failure behavior, as shown in Figure 35.
In Jeon et al. (2008), two full-scale parapet specimens were loaded with a ramping force until failure. The cracking patterns of each specimen at failure are shown in Figure 36. Values corresponding to each crack indicate the applied load (kN) at which the crack formed. In both tests, cracks formed predominately in a trapezoidal shape about the load application area, terminating at the top of the toe rather than at the base of the barrier. With the cracking patterns clearly
deviating from the yield-line mechanism currently presented in AASHTO LRFD BDS, the research team proposed a suite of possible yield-line patterns (Figure 37).
Possible yield-line mechanisms varied significantly. The current AASHTO LRFD BDS yield-line pattern is depicted in pattern YL1. Additional mechanisms following the same pattern as YL1 are shown, YL2 and YL3, which terminate at the top and bottom of the toe, respectively. The novel yield-line mechanism proposed by the research team, YL4, is characterized by a trapezoidal shape whose bottom edge is coincident with the top of the toe. YL5 describes a single, horizontal yield line at the top of the toe.
The parapet strength at each potential failure mechanism was evaluated. The strength of yield-line mechanisms YL1, YL2, and YL3 were determined from current AASHTO LRFD BDS guidance. Pattern YL5 was omitted from the evaluation, as its occurrence was deemed impossible for sufficiently long barrier spans.


Trapezoidal pattern YL4, which was of particular interest following the results of the static load tests, was analyzed in detail. The mechanism is shown in Figure 38. Using the same principles as those used to form the current AASHTO LRFD BDS guidance, Jeon et al. (2008) derived alternative strength equations corresponding to the trapezoidal yield-line mechanism. Equating the external work done by the applied load and the internal work associated with the rotation of the yield lines yielded a relationship between the applied load and the deformation of the barrier:
| (23) |
where H1 is the height of the trapezoid, Mw1 is the flexural strength of the parapet about the vertical axis over height H1, Mc1 is the flexural strength of the parapet about the longitudinal axis over height H1, x is the length of the base of the trapezoid, and α is the angle at which the diagonal yield-lines extend from the base of the trapezoid. Minimizing Equation 23 resulted in
| (24) |
The estimation of the parapet strength in Equation 24 assumes that the base of the trapezoid has a length x equal to the load application width, Lt. Values of x less than Lt are possible but were neglected in this study.
The strength of the barrier in each test was determined using yield-line patterns YL1 through YL4 and compared to the failure strength. This comparison is shown in Table 10. The trapezoidal

Table 10. Comparison of ultimate strengths (Jeon et al. 2008).
| Test | Lt (mm) | Theoretical Flexural Strength (kN) | Test Load at Failure (kN) | |||
|---|---|---|---|---|---|---|
| YL1 | YL2 | YL3 | YL4 | |||
| 1 | 1,070 | 614.0 | 442.6 | 513.6 | 434.3 | 330.0 |
| 2 | 2,440 | 751.7 | 566.2 | 659.4 | 528.4 | 360.0 |
yield-line pattern resulted in the lowest theoretical barrier strength. The research team suggests that because the trapezoidal yield-line pattern yielded the strength nearest the actual failure strength, this alternative yield-line pattern is the most accurate. However, the analysis assumed a trapezoid base length of Lt, which does not agree with the horizontal yield-line length observed in the static load tests. Additionally, it is possible that the ultimate strength of the barrier was controlled by punching shear rather than by flexure, further obfuscating the direct comparison between the theoretical yield-line strength and the measured failure load.
The trapezoidal modified yield-line mechanism was further studied by Khederzadeh and Sennah (2014). In this effort, the length of the horizontal yield-line at the base of the trapezoidal failure pattern was allowed to vary as a function of Lt, resulting in a more robust analysis method. Three unique scenarios were evaluated: (1) the length of the horizontal yield-line, x, is greater than the load application length, (2) the length of the horizontal yield-line, x, is equal to the load application length, and (3) the length of the horizontal yield-line, x, is less than the load application length. In addition to the introduction of variable base length, this method deviated from that of Jeon et al. (2008) in that the cantilever strength of the parapet was separated into the strength at the parapet base, Mc,b, and the average strength over the height of the parapet, Mc,w. For each scenario, equations were derived to estimate parapet strength. Khederzadeh and Sennah (2014) further bolstered the trapezoidal yield-line analysis method by expanding its application to parapet-end conditions, such as terminals and expansion joints. The suggested failure shape at barrier ends was clearly observed in a quasi-static load test performed by Alberson et al. (2005), the results of which are shown in Figure 39. The tested barrier was an F-shape bridge rail.
Each case is described by the product of the load application length, Lt, and a coefficient modifier, n, which varies from 0 to 2. These cases and their corresponding critical lengths and

Table 11. Modified yield-line analysis case directory.
| Case | Condition | Demonstration | Critical Length | Resistance |
|---|---|---|---|---|
| x ≥ Lt 1 ≤ n1 ≤ 2 |
Interior | Figure 40 | Equation 25 | Equation 26 |
| End | Figure 41 | Equation 27 | Equation 28 | |
| x < Lt 0 ≤ n2 < 1 |
Interior | Figure 42 | Equation 29 | Equation 30 |
| End | Figure 43 | Equation 31 | Equation 32 |
resistances are expressed in the figures and tables that follow. Figures and equations are linked to their respective cases in Table 11.
| (25) |
| (26) |
| (27) |
| (28) |


| (29) |
| (30) |
| (31) |
| (32) |
Using these equations, Fadaee et al. performed parametric studies on TL-4 and TL-5 parapet strengths with varying rebar spacing (Fadaee et al. 2018; Fadaee and Sennah 2018). The critical trapezoid base length and, consequently, the critical lateral load were determined for a variety of reinforcement configurations for a TL-4 F-shape barrier, a TL-4 vertical parapet, and a TL-5 F-shape barrier. With the results of the parametric study, the research team was able to identify the most efficient rebar spacing to achieve the design strength at interior and exterior locations. However, the strengths determined via the modified yield-line method were not compared to strengths determined via the traditional yield-line method.
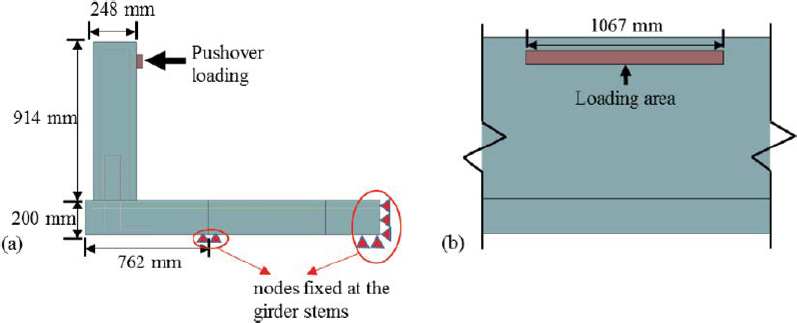
Cao et al. (2019) proposed a similar modified yield-line analysis method as a result of a simulation study of TL-4 and TL-5 concrete bridge rails. Noting a discrepancy between the rigid barrier models used in force estimation studies and the assumption of flexibility in capacity evaluations, Cao et al. performed pushover analyses to investigate the capacity of a TL-4 bridge rail subject to lateral loading. Employing an approach similar to that used in earthquake engineering, a quasi-static force was applied and incrementally increased until failure to obtain a load-deformation curve. The pushover test setup is shown in Figure 44.
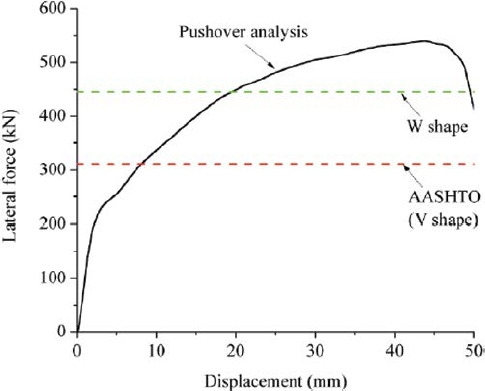
The load-deflection curve obtained in the simulated pushover test is shown in Figure 45. The capacity of the simulated barrier was 120 kips. At failure, the maximum reinforcement strain was roughly 1%.
If current AASHTO LRFD BDS guidance was used, the capacity of this barrier would be estimated at just 70 kips—significantly lower than the measured capacity. This discrepancy was attributed to the yield-line mechanism observed in the simulation, which was significantly different from the mechanism assumed in AASHTO LRFD BDS. The yield-line mechanism observed in the pushover simulation is shown in Figure 46.
The yield-line mechanism observed in the test is a clear deviation from the mechanism assumed in AASHTO LRFD BDS. As such, the accuracy with which the traditional yield-line equations

can estimate the barrier capacity is questionable. The modified, trapezoidal yield-line mechanism was also observed in the TL-4 and TL-5 impact simulations carried out in the same study and shown in Figures 47 and 48, respectively. With the trapezoidal yield-line mechanism appearing in the pushover analysis, both simulated crash tests, and a review of other literature, Cao et al. elected to investigate this modified pattern in further detail.
Using a method similar to that with which the traditional yield-line equations were derived (Hirsch 1978), Cao et al. (2019) derived an alternative capacity equation corresponding to the trapezoidal yield-line pattern:
| (33) |
wherein Rw is the critical lateral load, H1 is the height of the barrier, Mw1 is the flexural resistance of the barrier about its vertical axis, and Mc1 is the flexural resistance of the barrier about its longitudinal axis, evaluated on a per-foot basis. A detailed diagram of the yield-line mechanism is shown in Figure 49.
In this study, the modified yield-line method produced a more accurate barrier capacity estimate than the traditional yield-line method. The capacity of the barrier estimated using the modified yield-line method of Equation 33 was 100 kips, which was significantly closer to the measured capacity of 120 kips when compared to the traditional yield-line result of 70 kips. Cao et al. attributed in part the discrepancy between the modified estimate and the measured capacity to other resistance mechanisms associated with complete failure, such as tensile membrane action.


It should be noted that the resistance estimate formed by Cao et al. (2019) is heavily reliant on empirical assumptions. The actual, as-derived equation of the barrier resistance in this study was
| (34) |
in which α is the angle at which the yield lines on the impact face of the barrier extend from the base and x is the length of the top edge of the central trapezoidal plate. To achieve the recommended capacity equation, α was assumed to be 45o and x was assumed to be equal to Lt.
Inertial Activation
An additional modification to the yield-line method was proposed by Schrum et al. (2016). Whereas the previously discussed studies investigated the failure patterns of the yield-line mechanism, Schrum et al. sought a capacity estimation that accounted for the flexibility and inertial activation of the barrier. Traditional yield-line methods use energy conservation principles to determine capacities. Alternatively, Schrum et al. included momentum conservation principles to determine a modified critical length. The modified critical length determined via this method was then used in the existing AASHTO LRFD BDS yield-line resistance equation.
The relationship underpinning this method is expressed in Equation 35. In the arrest of the vehicle’s motion, the initial impact severity is transformed into barrier strain energy and internal energy (IE) within the vehicle. The strain energy (SE) was estimated as the product of the external force and the displaced distance of the barrier.
| (35) |
External force was considered equal to the maximum force the barrier could resist as a function of its flexural resistances:
| (36) |
where L is the activated length of the barrier. Displacement was determined by assuming 6% reinforcement strain, which was selected because it corresponds with the onset of strain hardening in tensile tests of rebar. This assumed deflected shape, shown in Figure 50, results in a lateral displacement of
| (37) |

To estimate the strain energy imparted to the barrier, the resistance of the barrier (Equation 36) is multiplied by the lateral deflection of the barrier (Equation 37).
| (38) |
Momentum conservation was used to estimate the change in the vehicle’s internal energy throughout the impact sequence. Initially, the total momentum of the system would be equal to the momentum of the vehicle. After impact, if the collision is assumed to be plastic, the vehicle and a portion of the barrier move together with a terminal momentum related to the activated barrier mass. This relationship is expressed in Equation 39:
| (39) |
where vf is the final velocity of the two-object system, vi is the initial velocity of the vehicle, mv is the mass of the vehicle, and mb is the activated inertial mass of the barrier.
Schrum et al. (2016) suggested that the length of the barrier set into motion is equal to the critical length, Lc, as demonstrated in Figure 51.
With this assumption, the activated mass can be estimated via Equation 40:
| (40) |
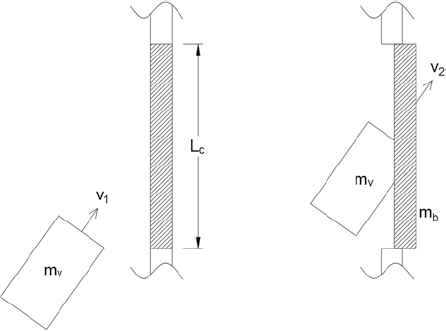
where ρc is the density of the concrete, A is the cross-sectional area of the barrier, and Lc is the activated length of the barrier. The final velocity of the vehicle, then, is
| (41) |
in which γc is the unit weight of the concrete, assumed as 150 pcf, and Wv is the weight of the vehicle. With the initial and terminal vehicle velocities estimated, an estimate for the change in the kinetic energy of the vehicle, which is theoretically equal to the change in the vehicle’s internal energy, can be expressed as
| (42) |
The governing equation, then, is expressed in Equation 43. Schrum et al. (2016) recommend the relationship is solved for the critical length, Lc, with a numerical solver. The critical length determined via this relationship is then used in the traditional yield-line resistance equation.
| (43) |
This modified method was validated via computer simulation in LS-DYNA. A simulated TL-4 impact between a safety shape barrier and an SUT was performed, and the change in the vehicle’s internal energy measured in the simulation was compared to the proposed estimate (Equation 42). Measurements were made in the simulation at the point at which longitudinal rebar reached 6% strain. The vehicle’s internal energy as-measured and as-calculated was 11.9% and 13.7% of the impact severity, respectively, indicating good accuracy of the method, provided the assumptions underlying the method are valid. However, the key assumption of 6% rebar strain was challenged in the pushover analysis performed by Cao et al. (2019) in which the maximum rebar strain was just 1%.
Schrum et al. (2016) used the modified critical length to reevaluate the capacities of several existing barriers, which were then compared to the capacities estimated via the traditional method. This comparison is shown in Table 12. Using the modified critical length results in near-universal increases in barrier capacity estimates, though, for most barriers, these increases are marginal. For some barriers, however, such as the TL-5 New Jersey barrier, the T5 bridge rail, and the T201 bridge rail, significant capacity increases were observed. The modified critical length yielded a lower capacity estimate for only one analyzed system, the T202 bridge rail, which is an open concrete rail.
Badiee (2014) presented a similar method where the inertial activation of the barrier is accounted for using conservation of momentum principles. However, whereas Schrum et al. (2016) used the critical length to estimate the activated mass of the barrier, Badiee set the activated barrier based on Lt. Additionally, Badiee calculated the moment of inertia of the barrier about its longitudinal axis to account for rotational inertia effects.
Effect of Impact Height on Capacity
While the traditional and modified yield-line methods differ in their failure patterns and derivations, these methods universally assume that the load is applied at the top of the barrier. However, recent research has shown impact heights to be lower than the total height of the barrier
Table 12. Comparison of traditional and modified capacity estimates (Schrum et al. 2016).
| Class | Barrier Type | H (in.) | Mb (k-ft) | Mw (k-ft) | Mc (k-ft/ft) | Existing Rw (kips) | Modified Rw (kips) | Percent Change |
|---|---|---|---|---|---|---|---|---|
| TL-4 | Vertical | 42 | 59.7 | 38.8 | 13.1 | 166.3 | 175.6 | 5.6% |
| 1-Slope | 32 | 0 | 15.1 | 31.3 | 170.6 | 173.0 | 1.4% | |
| F-Shape | 42 | 0 | 18.0 | 21.2 | 139.9 | 148.9 | 6.4% | |
| New Jersey | 32 | 0 | 8.0 | 11.6 | 71.8 | 76.3 | 6.3% | |
| 36 | 0 | 7.2 | 11.6 | 66.9 | 69.5 | 3.9% | ||
| 42 | 0 | 7.5 | 11.6 | 65.4 | 67.6 | 3.4% | ||
| TL-5 | Vertical | 42 | 59.7 | 38.8 | 13.1 | 185.4 | 187.4 | 1.1% |
| NJ | 42 | 0 | 7.5 | 11.6 | 85.3 | 107.5 | 26.0% | |
| Historic | T5 | 32 | 4.9 | 2.3 | 12.2 | 59.0 | 92.1 | 56.1% |
| T201 | 27 | 3.8 | 1.3 | 9.5 | 48.4 | 68.7 | 41.9% | |
| T202 | 27 | 20.5 | 0 | 11.9 | 80.0 | 55.9 | −30.1% |
(Silvestri-Dobrovolny et al. 2017; Bligh et al. 2017; Cao et al. 2019). Additionally, Silvestri-Dobrovolny et al. suggested that, due to the overestimation of load application height, barriers support a reserve capacity not accounted for in the current methodology.
In the derivation of yield-line equations, a virtual lateral displacement is applied to the top of the barrier. The product of this displacement and the barrier resistance is the work done on the barrier. The flexural yield-line mechanism is assumed to occur irrespective of load application height. For any impact height, the external work done by the impacting vehicle on the barrier is theoretically constant and equivalent to the available internal plastic strain energy developed along the yield lines. For impact heights lower than the top of the barrier, the product of applied load magnitude and displacement will be equal to the similar product of load and displacement at the top of the barrier (Figure 52). Consistent with yield-line theory, deflection is assumed to
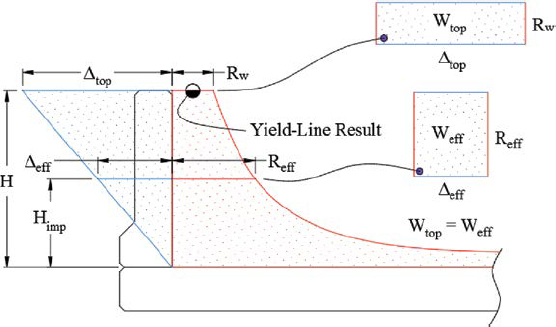
vary linearly with height. A relationship between the impact height and the effective flexural resistance, Reff, can be determined accordingly. This relationship is expressed in Equation 44 (Loken et al. 2019). Alternatively, Equation 44 can be achieved by deriving the yield-line equations with an initial assumption of a reduced impact height.
| (44) |
Punching Shear Capacity
Existing AASHTO LRFD BDS guidance does not recognize punching shear as a possible failure mechanism for concrete barriers. However, recent research has demonstrated that punching shear behavior is significant and may control the strength of concrete barriers. In a punching shear failure, a block of concrete fails along a critical perimeter about the impact region, as demonstrated in Figure 53.
Although punching shear failures are sometimes difficult to discern from yield-line failures, especially those with the recently proposed trapezoidal pattern, multiple studies have identified clear punching shear failures of concrete barriers. In a series of quasi-static load tests performed, Alberson et al. (2005) subjected three F-shape bridge rails to incrementally ramping loads until failure. While the first barrier specimen, which was loaded at its free end, failed in flexure, the latter two barrier specimens demonstrated clear punching shear failures. The damage sustained by these barrier specimens is shown in Figure 54. As a result of the experiment, Alberson et al. suggested that the failure of concrete barriers impacted in interior spans may be governed by punching shear, rather than flexure.
The punching shear capacity of concrete barriers was investigated in detail by Frosch and Morel (2016). As part of a bridge overhang study, seven short-span (3 ft), two medium-span (15 ft), and two long-span (30 ft) bridge deck and rail specimens were loaded to failure. Observed failure mechanisms varied with span length. All seven short-span specimens experienced deck-to-barrier joint failures, including diagonal tension failures and interface cracking (Figure 55). The two medium-span specimens experienced significant diagonal cracking consistent with the modified,


trapezoidal yield-line mechanism, though the failure of each specimen was controlled by interface failures similar to those exhibited by the short-span specimens (Figure 56).
When the span length was increased to 30-ft, the failure mechanism transitioned from deck-to-barrier interface failure to punching shear failure. The first long-span specimen was loaded with a slender application area (Figure 57) and exhibited clear punching shear behavior at 29.2 kips. The second long-span specimen was loaded with a squarer, lower aspect ratio application area (Figure 58), yet this specimen still failed in punching shear at 23.7 kips. Frosch and Morel (2016) suggested that, based on field observations of in-use barrier failures and the results of the testing sequence, yield-line mechanisms cannot occur in barriers of sufficiently long spans, as punching shear failure will occur at a lower lateral load.
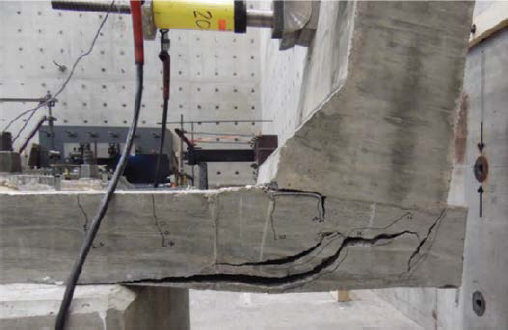


The reduction in strength from the high-aspect-ratio loading to the low-aspect-ratio loading is anomalous, compared to the guidance of AASHTO LRFD BDS and ACI 318-19 (ACI 2019). In general, punching shear strength (Vc) can be expressed as
| (45) |
where fc′ is the compressive strength of concrete, bo is the punching shear critical perimeter, d is the average depth of the slab over the punching shear region, λs is the size effect factor penalizing the strength of slabs thicker than 10 in., λ is the lightweight concrete factor, and K is a coefficient modifier, which is a function of the aspect ratio of the load application area. Theoretically, K is bounded by 2 and 4, which correspond to ideal one-way and ideal two-way shear strengths of concrete, respectively. As the aspect ratio of the load application area increases, the shear strength would be expected to decrease, as the concrete would approach its one-way shear strength on the long edges of the loaded region. In this experiment, however, the opposite was observed, with the coefficient K being estimated at 2 and 4 for the low-aspect-ratio and high-aspect-ratio loadings, respectively.
The findings observed by Frosch and Morel (2016) were reflected in quasi-static load tests of GFRP-reinforced bridge rails performed by Sennah et al. (2018). The test sequence consisted of five load tests performed at various locations along a 130-ft rail span. Three tests were performed on the continuous barrier with a load application length of roughly 95 in. at three locations: (1) a free end of the barrier, (2) a construction joint, and (3) within a fully continuous span. At all three locations, clear punching shear failure was observed, as shown in Figures 59 through 61. Sennah et al. (2018) suggested that the punching shear behavior could be attributed to the disparities between steel and GFRP reinforcement, including bond characteristics and material stiffness. After these tests were performed, two 39-in.-long spans were sawn and partitioned from the system and loaded to failure. Both short-span barrier segments exhibited significant horizontal yield-line cracking and deck-to-barrier joint failure, as shown in Figure 62.
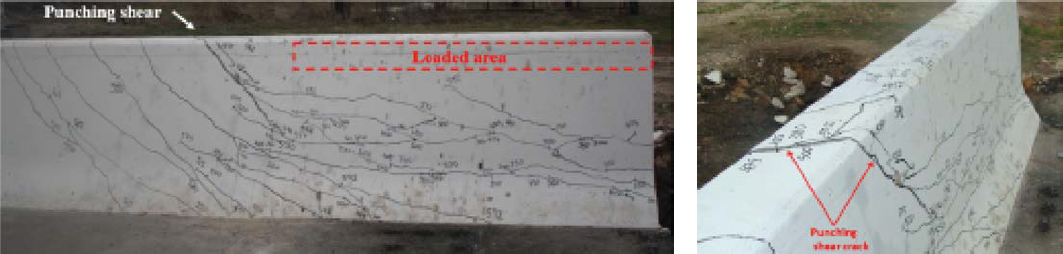


Additionally, punching shear failures of both a solid concrete barrier, TxDOT (Texas DOT) T501, and an open concrete rail, TxDOT T203, were evident in a bogie testing suite conducted by Williams, Buth, and Menges (2007). Clear 45-degree-lateral crack propagation and brittle failures were observed. Examples of punching shear failures of solid barriers and open concrete rails observed in this study are shown in Figure 63.
According to ACI 318-19, the punching shear capacity may include the contribution of the steel reinforcement only if the slab is at least 6-in. deep and at least 16 times as deep as the diameter of the shear reinforcement. For example, to account for the shear strength of No. 6 vertical bars in a concrete parapet bridge rail, the parapet must be at least 12-in. thick. If these criteria are met, the total shear strength (Vn) is
| (46) |
where Vc is the punching shear strength of the concrete and Vs is
| (47) |
in which Av is the sum of the steel areas spanning the theoretical inclined shear failure surface and oriented with bar axes parallel to the shear load, and fyt is the yield strength of the transverse steel.


GFRP-Reinforced Concrete Parapets
A GFRP-reinforced concrete bridge rail was successfully crash tested to MASH TL-5 criteria in 2010 (Sennah and Hedjazi 2019; Sennah and Mostafa 2018). The study and related reports highlighted three key aspects: (1) reduction of GFRP reinforcement by substituting higher-strength GFRP material in a standard detail accepted in Canada, (2) use of a headed anchorage rather than hooked bars at the barrier-to-deck connection, and (3) significance of punching shear as a controlling limit state mechanism. Although the authors noted that the yield-line approach did not apply to nonductile GFRP-reinforced parapets, they did not present an alternative methodology. The crashworthiness of the GFRP-reinforced barrier was inferred by comparing a proposed alternative design to a reference design that had been subjected to pendulum testing. The bridge rail design, shown in Figure 64, featured a unique, diagonal-headed bar spanning the joint between the bridge rail and the deck. The overhang was a traditional steel-reinforced concrete deck. In the crash test, the bridge rail was impacted at a control joint, experiencing some spalling near the top of the parapet and cracking consistent with punching shear about the impact point. Maximum dynamic deflection was roughly 2.5 in. Damage to the system was consistent with the punching shear mechanism observed in a static, ultimate load test performed on the same barrier (Sennah et al. 2018).
Steel-Reinforced Open Concrete Rails
The design and evaluation of open concrete rails vary significantly from that of solid concrete barriers. Currently, AASHTO LRFD BDS recommends that the capacity of open concrete rails be estimated using the inelastic method. However, the yield-line method is also applicable and may be a more appropriate method for analyzing open concrete rails. Yield-line mechanisms of open concrete rails are expectedly more complicated than those of solid concrete barriers, and existing methods are insufficiently robust to warrant official guidance. The only documented yield-line analysis method for open concrete rails was proposed by Hirsch (1978). In this method, Hirsch accounted only for midspan impact and assumed that the yield-line mechanism would originate at the bottom corners of adjacent posts about a gap and extend diagonally outward

to the beam (Figure 65). The resistance of the open rail and the critical length are expressed in Equations 48 and 49, respectively.
| (48) |
| (49) |
Both the inelastic method described in AASHTO LRFD BDS and the yield-line mechanism proposed by Hirsch have appreciable shortcomings. The inelastic method was derived for metal post-and-beam systems and later modified to apply to open concrete rails, resulting in a method that is incongruous with the systems it is meant to evaluate. Yield-line analysis does not necessarily provide better estimates for open concrete rails, however, as it does not account for multiple-span failures or impacts centered on posts. Currently, failure mechanisms and capacity estimations of open concrete rails are not well understood.
Researchers at MwRSF are currently conducting an effort to design a TL-4 open concrete bridge rail (Delone and Schmidt 2019). This effort includes an investigation of capacity estimation methods for open concrete rails. Preliminary findings indicate significant discrepancies between the inelastic method and the midspan yield-line mechanism. For example, the inelastic method assumes that beam hinges will form at posts. This assumption is sound for metal posts,
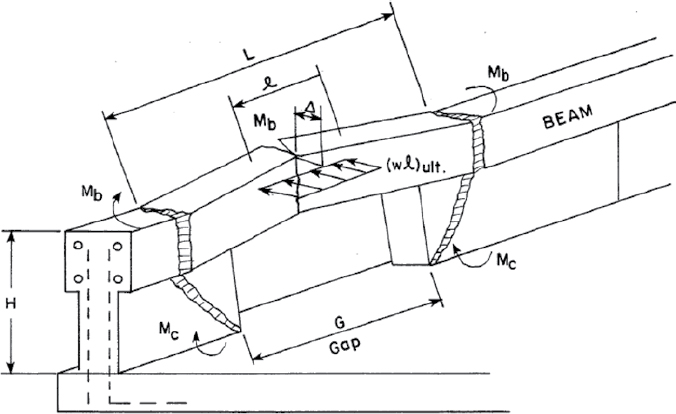
which are relatively thin compared to their longitudinal dimension between hinges. However, concrete posts are typically much wider in cross-section than metal posts, and hinging is more likely to occur at the edge of a post, rather than at its centerline. If the center-to-center post spacing is replaced with the gap length in the inelastic method, capacity estimates are increased. Additionally, if the post spacing in the inelastic method and the critical length in the yield-line mechanism are both set equal to the gap length, the two methods yield the same result. However, as shown in Figure 65, the critical length will always be greater than the gap spacing due to the assumptions underlying the mechanism. These observations indicate that, for one-span failure mechanisms, the yield-line mechanism will produce greater capacity estimates than the inelastic method. While further research is needed to investigate impacts at posts and multiple-span mechanisms, these preliminary results suggest a potential underestimation of open concrete rail strength when using the inelastic method.
GFRP-Reinforced Open Concrete Rails
Buth et al. (2003) reported on two full-scale crash tests incorporating GFRP bars in an open concrete rail and deck. The authors indicated that the rails had been designed for two conditions: one condition representing new construction (exposure coefficient, CE = 0.7, resulting in a relatively high reinforcement ratio) and one condition to represent deteriorated capacity with age (exposure coefficient, CE = 1, resulting in a relatively low reinforcement ratio). The concrete barrier height was 27 in. Both tests were performed according to NCHRP Report 350 test designation 3-11. In the first test, the vehicle impacted the barrier designed using CE = 0.7 (see Figure 66). Only minor damage was noted to the railing, and hairline cracking was noted in the deck. The low height of the barrier resulted in the test vehicle rolling onto its side, failing a required NCHRP Report 350 criterion. To mitigate vehicle roll, an HSS (hollow structural section) 6 × 3 × ¼ in. rectangular steel tube was mounted to the top of the barrier, raising the traffic-face height to 30 in. (see Figure 67). The second test passed all required NCHRP Report 350 criteria, with minimal damage to the concrete railing and no damage noted for the deck.
Matta and Nanni (2009) investigated a modified version of the Kansas corral rail with fiber-reinforced polymer (FRP) reinforcement. After performing static load tests on two full-scale

specimens, Matta and Nanni developed an analytical model of the system’s deflection response. The maximum displacement at the top of the post was approximated as the sum of two flexural responses: (1) the downward bending of the deck and (2) the backward bending of the bridge rail. These flexural responses are demonstrated in Figure 68. Matta and Nanni provided relationships for determining the total deflection, which included the overhang rotation and transverse deflection of the rail in an idealized cantilever response. Nonlinear effects were modeled at the deck and the post-to-deck connection by replacing gross moments of inertia with effective moments of inertia after cracking was expected to occur.
This deflection estimate was used to develop a simplified dynamic model of the system in which the posts were idealized as lateral springs. This model, shown in Figure 69, was used to analyze the effect of post-opening length on the overall capacity of the bridge rail. The relationship between opening length and transverse load resistance for the modified Kansas corral rail investigated by Matta and Nanni is shown in Figure 70.
MASH-Compliant Systems
Many successful full-scale crash tests on concrete bridge rails have been conducted to MASH criteria. A summary of MASH-compliant concrete bridge rails is shown in Table 13.
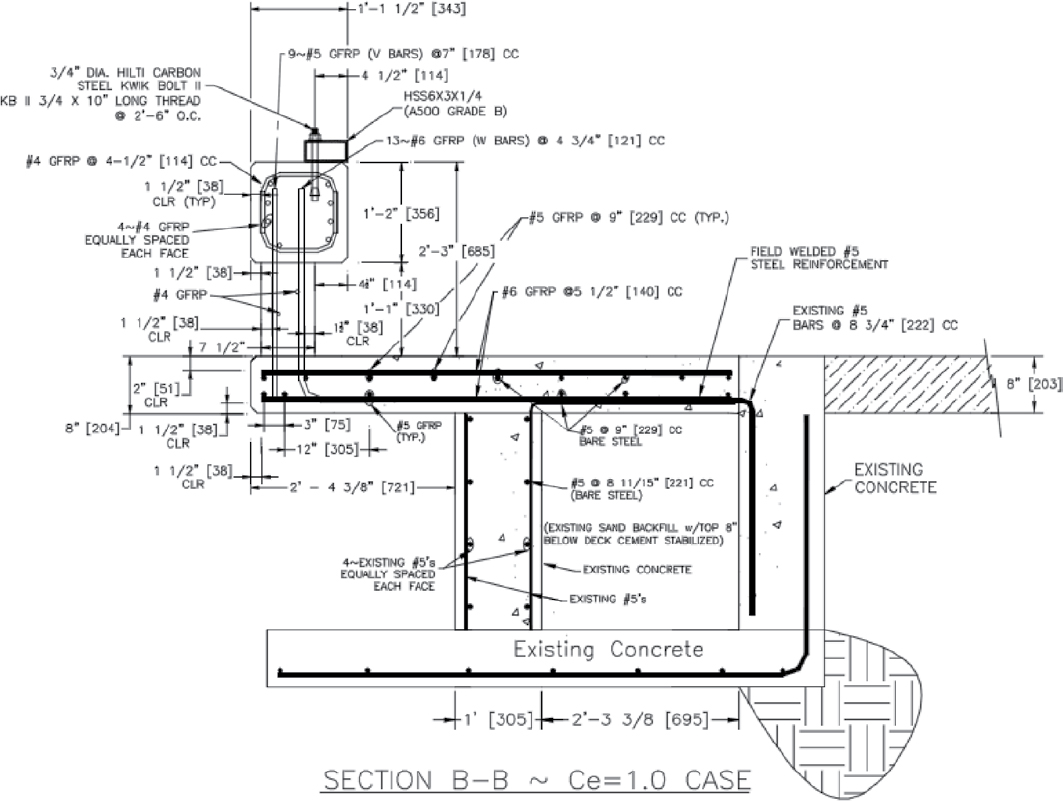

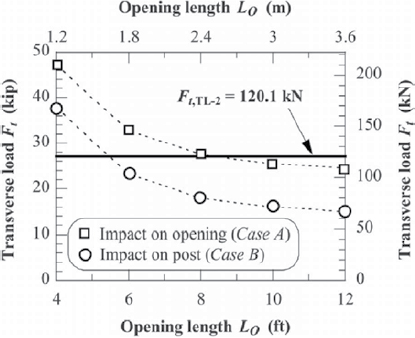
Table 13. MASH-compliant concrete bridge rail systems.
| Barrier Name | Barrier Type | MASH Test Level | Test Agency | Reference |
|---|---|---|---|---|
| Caltrans Type 732SW | Solid | 2 | Caltrans | Whitesel et al. 2016 |
| TxDOT C411 | Open | 2 | TTI | Bligh, Menges, Griffith, et al. 2019 |
| Caltrans Single-Slope Type 60 | Solid | 3 | Caltrans | Whitesel et al. 2018 |
| Vertical-Faced Temporary Barrier | Solid | 3 | MwRSF | Schmidt et al. 2009 |
| Conti Half Shape Temporary Barrier | Solid | 3 | PTIa | Shah 2011 |
| TxDOT Type Single-Slope Traffic Rail | Solid | 3 | TTI | Williams, Bligh, and Menges 2011 |
| TxDOT Type T222 | Solid | 3 | TTI | Williams, Bligh, and Menges 2014 |
| TxDOT Type T223 | Open | 3 | TTI | Arrington et al. 2011 |
| 36-in. Single-Slope Barrier | Solid | 4 | TTI; MwRSF | Sheikh et al. 2011; Rosenbaugh 2019 |
| Precast Single-Slope Barrier | Solid | 4 | TTI | Williams, Sheikh et al. 2018 |
| TxDOT 36-In.-Vertical Wall | Solid | 4 | TTI | Bligh et al. 2018 |
| Manitoba Tall Wall | Solid | 5 | MwRSF | Rosenbaugh et al. 2016 |
| TxDOT C412 | Open | 5 | TTI | Bligh, Menges, Griffith, et al. 2019 |
| TxDOT Type T224 | Open | 5 | TTI | Williams, Bligh, Menges, et al. 2015 |
aPennsylvania Transportation Institute.
Metal Post-and-Beam Bridge Rails
Metal post-and-beam bridge rails are composed of metal beams fastened to posts that extend from either the top or side of the deck. The behavior of the railing system depends on the location at which posts are secured to the deck. As such, metal post-and-beam rails can be separated into two categories: top-mounted systems and side-mounted systems. Top-mounted systems may be secured directly to the deck or a concrete curb. Examples of these systems are shown in Figure 71.
Existing AASHTO LRFD BDS Philosophy
Current AASHTO LRFD BDS recommends that the inelastic method (Hirsch 1978) be used to design and evaluate metal post-and-beam bridge rails. Under current guidance, the inelastic method is also applied to open concrete rails. A more detailed discussion of the method, then, is provided in the preceding section of this review. Overall, the inelastic method for metal rails involves determining the minimum resistance associated with a critical number of failing spans, which is identical to the procedure for open concrete rails. For metal rails, however, the vertical-axis bending strength of the concrete beam, Mb, is replaced with the inelastic resistance of all metal rails contributing to a plastic hinge, Mp, and the longitudinal-axis bending strength of the concrete post, Mc,post, is replaced with the plastic moment resistance of the metal post, Mpost. The resistance estimation equations for metal post-and-beam systems, then, are as follows. For interior failure modes involving an odd number of railing spans, the resistance is estimated as
| (50) |
Whereas for interior failure modes involving an even number of railing spans, the resistance is estimated as
| (51) |

in which L is the post spacing (ft), Mp is the inelastic resistance of all rails contributing to a plastic hinge about the vertical axis (k-ft), and Pp is the shear force on a single post (kips), which is equal to
| (52) |
where Mpost is the plastic moment resistance of a single post about the longitudinal axis (k-ft), and is the height of the barrier resultant force (ft), which is determined via Equation 53
| (53) |
in which Ri is the resistance of an individual component (kips), and Yi is the distance from the bridge deck to the ith rail (ft).
To determine the resistance of an interior span, Equations 50 and 51 are evaluated for increasing values of N until the minimum value of R is identified. For end segments, the resistance of the barrier is calculated in Equation 54.
| (54) |
Current guidance also stipulates deck thickness based on how the railing is secured to the deck. AASHTO LRFD BDS recommends deck thicknesses of 12 in. and 8 in. for side-mounted and top-mounted post systems, respectively. Lesser thicknesses are permissible if proven adequate in a crash-testing procedure.
State of the Art
While no significant changes to the inelastic method have been proposed since its formulation, several research efforts have described the method in greater detail than the current AASHTO LRFD BDS guidance. For example, Buth et al. (1993) noted requirements that must be met for the capacity estimates of the inelastic method to be achieved: (1) elastic buckling of members must be prevented, (2) material must be sufficiently ductile to form plastic hinges, (3) connection strength must not control failure, and (4) member cross sections must not be prone to local buckling at the locations of expected plastic hinging. While these requirements may be considered within the domain of good engineering judgment, their exclusion from current guidance could result in their being overlooked.
Silvestri-Dobrovolny et al. (2017) evaluated existing metal post-and-beam rail systems using the inelastic method. In their analysis, the research team investigated many failure mechanisms beyond the guidance of AASHTO LRFD BDS, including the plastic strength of posts, ultimate strength of anchor bolts, post weld strength, baseplate weld strength, and block shear rupture of the anchorage.
The inelastic method remains the primary capacity estimation tool when designing metal post-and-beam systems. For example, in 2019, researchers at MwRSF designed a TL-4 metal post- and-beam bridge rail system using current AASHTO LRFD BDS guidance (Pena et al. 2019). In addition to using the inelastic method, detailed analyses and component testing were performed to encourage plastic hinging in posts at strategic locations and to ensure the integrity of the deck-to-barrier connection. Full-scale crash testing confirmed MASH TL-4 compliance.
MASH-Compliant Systems
Numerous metal post-and-beam systems have been successfully crash tested since the implementation of MASH criteria in 2009 (AASHTO 2009b). A summary of MASH-compliant metal post-and-beam systems is shown in Table 14.
Post-and-Beam Rail Mounted on a Concrete Parapet
Some bridge rails are composed of two railing types, such as a metal post-and-beam subsystem secured to the top of a concrete parapet. Examples of these bridge rails are shown in Figure 72. Note that this category of bridge rails is relatively subjective. Classification of a system as a metal post-and-beam rail or a parapet-mounted rail depends on the impact behavior of the lower concrete subsystem. Short concrete subsystems may act as a curb or not bear significant lateral loads, whereas taller concrete subsystems will accept significant lateral loads and strongly participate in redirection. Such systems should be classified as metal post-and-beam rails and parapet-mounted rails, respectively. Concrete bridge rails with pedestrian or bicycle rails secured to their top should not be considered in this category, as the metal subsystem does not participate significantly in vehicle containment.
Existing AASHTO LRFD BDS Philosophy
The analysis of parapet-mounted rails is an intersection of the methods used to evaluate concrete and metal systems. The strengths of the concrete and metal subsystems are estimated individually. The overall resistance of the parapet-mounted rail is determined as the lesser of the
Table 14. MASH-compliant metal post-and-beam systems.
| Barrier Name | Mounting Location | MASH Test Level | Test Agency | Reference |
|---|---|---|---|---|
| TxDOT Type T1F | Topa | 3 | TTI | Williams, Bligh, et al. 2007 |
| TxDOT Type T1P | Topa | 3 | TTI | Williams, Bligh, and Menges 2012 |
| TxDOT Type T1W | Topa | 3 | TTI | Bligh, Menges, Griffith, et al. 2019 |
| TxDOT Type T131RC | Topa | 3 | TTI | Williams, Bligh, and Menges 2012 |
| Alaska Multi-State 2-Tube Rail | Topa | 4 | TTI | Williams, Menges, and Griffith 2019 |
| Caltrans ST-70SM | Side | 4 | Caltrans | Her et al. 2017 |
| Side-Mounted Steel Tube Rail | Side | 4 | MwRSF | Pena et al. 2019 |
| TxDOT Type C2P | Topa | 4 | TTI | Williams, Bligh, et al. 2017 |
| TxDOT Type C2P (Picket) | Topa | 4 | TTI | Williams, Bligh, et al. 2017 |
| TBTAb Bridge Rail | Side | 5 | TTI | Sheikh et al. 2016 |
| Three-Rail Steel Bridge Rail | Topa | 5 | TTI | Taneja 2018 |
aTop-mounted on curb.
bTriborough Bridge and Tunnel Authority.
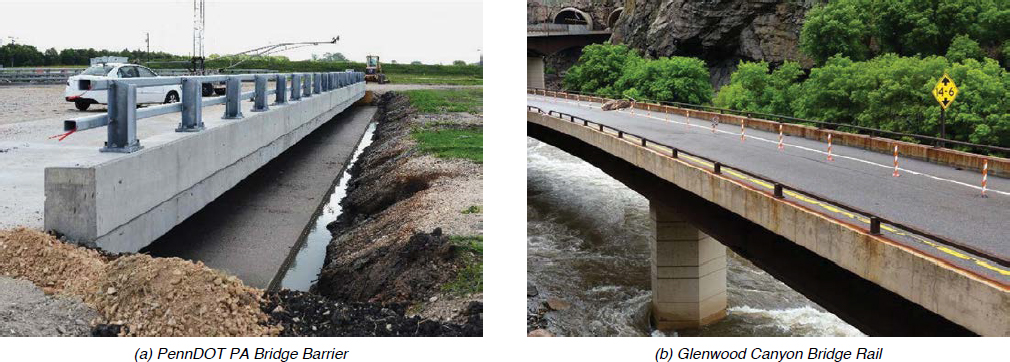
resistance of the system when impacted at a rail midspan and when impacted at a post, as shown in Figure 73 and demonstrated in Equation 55.
| (55) |
When impacted at a rail midspan, the maximum resultant strength is determined as
| (56) |

where RR is the ultimate capacity of the rail over one span (kips) and RW is the ultimate capacity of the wall as determined via yield-line analysis (kips). Alternatively, when impacted at a post, the maximum resultant strength is determined as
| (57) |
where Pp is the ultimate transverse resistance of a post (kips), R′R is the ultimate transverse resistance of the rail over two spans (kips), and R′W is the capacity of the wall, reduced to resist the post load
| (58) |
in which HR is the height of the rail (ft) and HW is the height of the concrete wall (ft).
State of the Art
No significant research regarding the design or evaluation of parapet-mounted rail systems was identified. Current AASHTO LRFD BDS guidance continues to be used in practice, with no research efforts suggesting defects or proposing improvements to parapet-mounted rail analysis.
MASH-Compliant Systems
Several parapet-mounted rail systems have been successfully crash tested to MASH criteria. A summary of MASH-compliant parapet-mounted rails is shown in Table 15.
Flexible Bridge Rails
Flexible or semi-rigid bridge rails are systems designed to deform significantly when impacted. The flexibility of guardrail-style bridge rails can mitigate the need for an approach guardrail transition, as the stiffness of the approach guardrail and bridge rail is not significantly different. Due to their efficient energy dissipation, flexible bridge rails typically impart less severe accelerations
Table 15. MASH-compliant parapet-mounted rail systems.
| Barrier Name | MASH Test Level | Test Agency | Reference |
|---|---|---|---|
| Glenwood Canyon Bridge Rail | 3 | TTI | Bligh, Menges, and Schroeder 2019 |
| AIMS Liferail Retrofit Bridge Rail | 4 | TTI | Lawler 2019 |
| TxDOT C402 Bridge Rail | 4 | TTI | Bligh, Menges, Griffith, et al. 2019 |
| William P. Lane, Jr. Bridge Rail | 4 | TTI | Williams, Menges, and Kuhn 2018 |
| 39-In. Lake Pontchartrain Causeway Rail | 4 | TTI | Williams, Bligh, et al. 2015 |
| 46-In. Lake Pontchartrain Causeway Rail | 4 | TTI | Williams, Bligh, et al. 2016 |
| MDS-5 Bridge Raila | 5 | BAStb | Ray and Mastova 2008 |
aMDS-5 is a metal post-and-beam subsystem secured to the top of a steel parapet.
bGerman Federal Highway Research Institute.
to the impacting vehicle. Furthermore, post flexibility and the implementation of breakaway posts can significantly reduce the magnitude of forces transmitted to the bridge deck. Examples of guardrail-style bridge rail systems are shown in Figure 74.
Existing AASHTO LRFD BDS Philosophy
Currently, AASHTO LRFD BDS provides no guidance on flexible bridge rail systems. However, Section 13.7.3.1.1 states that successfully crash-tested systems may be implemented without further analysis. As such, current guidance allows the use of flexible bridge rails proven crashworthy in full-scale testing.
State of the Art
Flexible bridge rail systems cannot be evaluated using the inelastic method. The strength of these systems is not owed primarily to post-and-beam flexure. Instead, much of the strength of flexible systems is due to the tensile membrane action of the beam. As such, the methods used to estimate barrier strength in AASHTO LRFD BDS are invalid for flexible bridge rails.
Although flexible bridge rails have seen use since the TxDOT Type T6 bridge rail was developed in 1978, relatively few systems have been tested to MASH criteria. In 2010, researchers at MwRSF conducted an extensive research effort to design a low-cost, energy-absorbing, flexible bridge rail (Thiele et al. 2010). After investigating numerous energy-dissipating mechanisms and mounting configurations, the research team arrived at a final design that featured a W-beam secured to side-mounted weak posts. Due to the low stiffness of the system relative to typical rails, the system does not require a transition when used in conjunction with the Midwest Guardrail System (MGS) (Lechtenberg et al. 2004). The flexible system, shown in Figure 75, was subjected to two full-scale crash tests and proven adequate to MASH TL-3 criteria.
Since the development of the MGS-compatible flexible bridge rail at MwRSF, three additional flexible bridge rails have been designed and successfully crash tested. In 2013, researchers at TTI designed a flexible TL-2 bridge rail incorporating features from the MGS-compatible system designed at MwRSF (Williams, Bligh, et al. 2013). This system, the TxDOT Type T631LS, was successfully crash tested to MASH TL-2 criteria. Shortly after, in 2016, this design was modified to meet MASH TL-3 criteria, resulting in the TxDOT Type T631 system (Williams, Bligh, et al. 2016). Most recently, a side-mounted flexible system was successfully crash tested to MASH TL-2 criteria at MwRSF (Rosenbaugh et al. 2019).
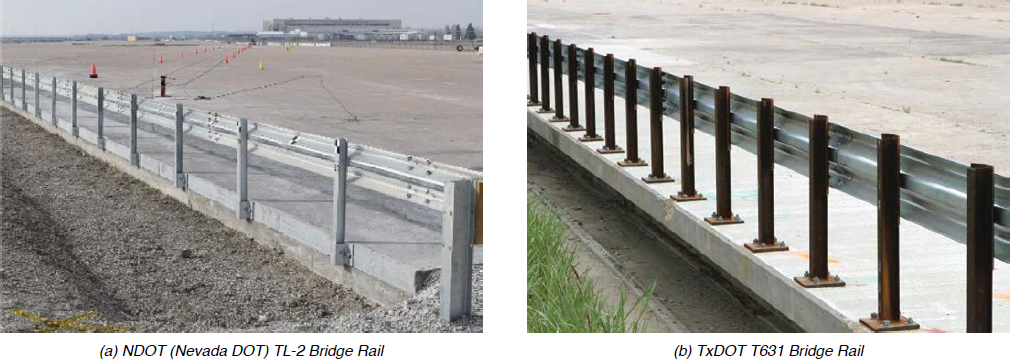

An alternative type of flexible barrier system involves the use of rubber shear fenders, which allow for significant deformation of otherwise rigid barriers. Examples of this barrier type include the RESTORE barrier developed at MwRSF (Schmidt et al. 2015) and the TxDOT rubber-mounted, single-slope median barrier developed at TTI (Abu-Odeh et al. 2019). The designs of these systems are shown in Figure 76.
MASH-Compliant Systems
A summary of crash-tested flexible bridge rails meeting MASH criteria is shown in Table 16. Few flexible bridge rails have been tested to MASH criteria, and no guardrail-style bridge rails have been tested to conditions more severe than TL-3. However, flexible elastomer barriers developed at MwRSF and TTI have been tested successfully to MASH TL-4 conditions.

Table 16. MASH-compliant flexible systems.
| Barrier Name | MASH Test Level | Test Agency | Reference |
|---|---|---|---|
| NDOT TL-2 Bridge Rail | 2 | MwRSF | Rosenbaugh et al. 2019 |
| TxDOT Type T631LS | 2 | TTI | Williams, Bligh, et al. 2013 |
| MGS Bridge Rail | 3 | MwRSF | Thiele et al. 2010 |
| TxDOT Type T631 | 3 | TTI | Williams, Bligh, et al. 2013 |
| RESTORE Barrier | 4 | MwRSF | Schmidt et al. 2015 |
| TxDOT Rubber-Mounted Single-Slope Barrier | 4 | TTI | Abu-Odeh et al. 2019 |
Timber Bridge Rails
Timber bridge rail systems are those whose designs primarily feature wood elements and can be constructed from glue-laminated (glulam) or sawn timber. Timber bridge rails may be selected over more typical concrete or metal systems for a variety of reasons. Wood is a lightweight material with a favorable energy dissipation response for impact attenuation, and, in some cases, wood may be more readily available than concrete or steel. Additionally, timber systems provide a natural, rustic appearance well-suited to natural surroundings (Polivka et al. 2002). Examples of timber bridge rail systems are shown in Figure 77.
Existing AASHTO LRFD BDS Philosophy
Current AASHTO LRFD BDS guidance advises against designing timber bridge rails with the methods used for concrete and metal systems. Instead, it is recommended that timber systems be designed using elastic linear analysis with member sections proportioned based on their resistances. The strength limit state, rather than the extreme limit state, is recommended for timber systems.
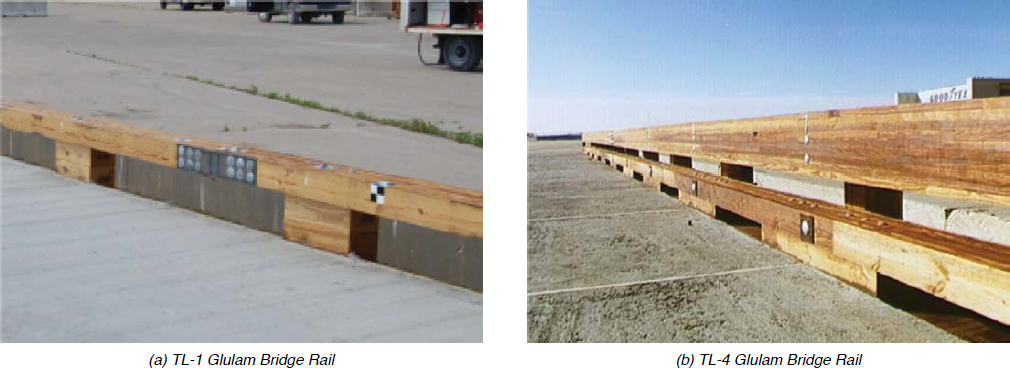
Resistances of timber posts and rails are determined using the methodology of AASHTO LRFD BDS Section 8 (AASHTO 2020a). The factored flexural resistance of a timber element is determined as
| (59) |
in which S is the section modulus, CL is a beam stability factor, and Fb is the flexural design value, determined as
| (60) |
where Fbo, the flexural design value of the wood species, is multiplied by modification factors to account for analysis, environmental, and structural conditions. CKF converts the design value from Allowable Stress Design to LRFD, CM accounts for the effects of moisture, CF accounts for imperfections in sawn timber, such as knots or checks, Cv is a volume factor for glulam elements, Cfu is a flat-use factor for glulam elements with loads applied to the wide face of lamina, Ci accounts for small holes pressed into the surface of sawn timber during the incising process, Cd accounts for deck flexibility, and Cλ is a time effect factor. Similarly, the factored shear resistance is determined as
| (61) |
in which b is the width of the element, d is the depth of the element, and Fv is the shear design value, determined as
| (62) |
where Fvo is the shear design value of the wood species.
State of the Art
Successful timber rails have been designed using methods not described in AASHTO LRFD BDS. For example, the finite element analysis program BARRIER-VII has aided in the design process of several timber systems (Faller et al. 1996; Polivka et al. 2002; Polivka et al. 2003; Hitz et al. 2006). Additionally, although LS-DYNA has not yet been used to design a timber system, the program features a wood material model that could be used to simulate timber systems.
Recent research has indicated that the penalized elastic method described in AASHTO LRFD BDS may result in significantly overdesigned timber systems. In 2018, researchers at MwRSF conducted full-scale crash tests to MASH TL-3 criteria with a glulam timber guardrail (Schmidt et al. 2019). The first test of the series in which the 2270P test vehicle impacted the system at a rail midspan is shown in Figure 78.
To determine the flexural demand imparted to the rail, the posts were assumed to be rigid, and a 70-kip load distributed over 4 ft was applied to the rail. The loading conditions used for analysis were consistent with the alternative TL-3 values proposed in NCHRP Project 20-07(395) (Silvestri-Dobrovolny et al. 2017). The capacity of the system was estimated using the methodology described in AASHTO LRFD BDS. Analysis showed that, when the capacity was compared to the demand, the system was significantly overstressed, with the demand exceeding the capacity by 20 to 30%. In the test, however, the rail performed adequately. The rail was severely gouged, but the section did not fail or deform plastically, as shown in Figure 79.

MASH-Compliant Systems
Only one timber bridge rail system has been successfully crash tested to MASH criteria, as shown in Table 17. However, multiple timber bridge rails were previously deemed compliant with NCHRP Report 350 standards, ranging from TL-1 to TL-4. Due to the scarcity of MASH-compliant timber systems, a summary of NCHRP Report 350-compliant systems is shown in Table 18. Recently, researchers at MwRSF surveyed state DOTs, federal agencies, and industry consultants to gauge interest in future MASH testing of timber systems (Duren and Faller 2019). Results of the survey indicated significant interest in a MASH-compliant TL-4 timber bridge rail with curb.
Ground-Mounted Railing
Bridge rail systems are often secured to ground-mounted grade beam anchorages, wing walls, and retaining walls rather than a cantilevered deck overhang. Rail systems secured to

Table 17. MASH-compliant timber systems.
| Barrier Name | MASH Test Level | Test Agency | Reference |
|---|---|---|---|
| Low-Height, Curb-Type Glulam Bridge Rail | 1 | MwRSF | Rosenbaugh et al. 2009 |
Table 18. NCHRP Research 350-compliant timber systems.
| Barrier Name | NCHRP Report 350 Test Level | Test Agency | Reference |
|---|---|---|---|
| Glulam Wood Curb Railing | 1 | MwRSF | Faller et al. 1996 |
| Glacier Removable Bridge Rail | 1 | TTI | Bullard et al. 2004 |
| TL-2 Glulam Bridge Rail | 2 | MwRSF | Polivka et al. 2003 |
| Tubular Steel-Backed Timber Rail | 3 | TTI | Bullard et al. 2004 |
| GC-8000 Bridge Rail | 4 | MwRSF | Hitz et al. 2006 |
| TL-4 Glulam Bridge Rail | 4 | MwRSF | Polivka et al. 2002 |
MSE retaining walls have been extensively researched, while bridge rail systems secured to grade beams or other wall types have not. The integrity of any bridge rail system depends heavily on the structure to which it is secured. The design of the retaining wall/rail anchorage structure is ultimately of equal importance to that of the bridge rail, as either can limit the strength of the overall system in the event of a vehicle impact.
MSE walls consist of three major components: (1) retaining wall, (2) moment slab (typical), and (3) traffic barrier. When the barrier is impacted by a vehicle, the moment slab resists overturning of the barrier, and impact forces are distributed through the MSE wall and into the retained soil. This review is limited to the design and analysis of the barrier-slab system. An example bridge rail secured to an MSE wall is shown in Figure 80.
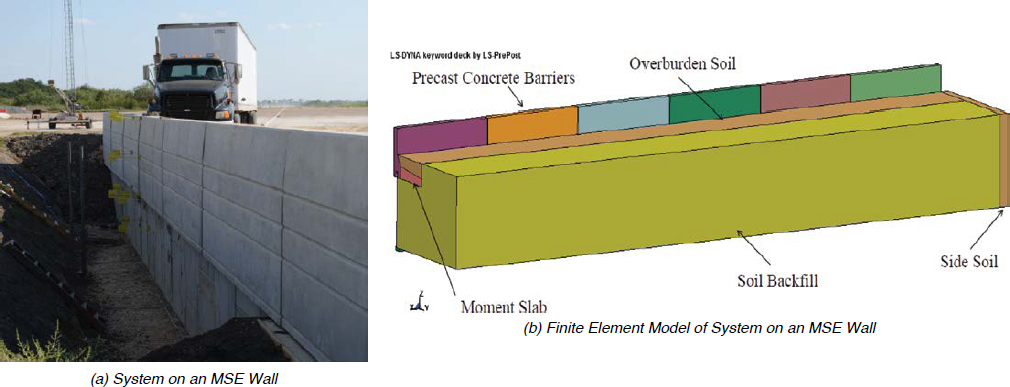
Existing AASHTO LRFD BDS Philosophy
No guidance for the design or analysis of systems secured to wing walls, ground-mounted grade beam anchorages, or retaining walls is provided in AASHTO LRFD BDS Section 13. However, the design of MSE walls as it relates to barrier loading is discussed in AASHTO LRFD BDS Section 11.10.10.2. Current guidance stipulates barriers constructed over MSE walls be designed to resist overturning moments with their mass alone and that the moment slab has sufficient strength to resist the ultimate strength of the barrier. It is recommended that moment slabs do not have transverse joints, with the exclusion of construction joints, and that adjacent slabs are connected with shear dowels. To ensure that the upper soil reinforcement layers have sufficient tensile capacity, a 10-kip load is applied over a 5-ft barrier length. To check for pullout of the soil reinforcement, a 10-kip load distributed over a 10-ft span is also applied to the top layer of reinforcement. Additionally, it is recommended that flexible post-and-beam barriers be placed at least 3 ft from the MSE wall face with posts spaced such that they do not interfere with soil reinforcements.
State of the Art
NCHRP Report 663: Design of Roadside Barrier Systems Placed on MSE Retaining Walls (Bligh et al. 2010) presented an extensive study to determine new guidelines for the design of barrier systems secured to MSE walls. The research effort consisted of a review of existing design practices, a survey of state transportation agencies, and MASH TL-3 crash testing of a barrier system secured to an MSE wall. From the results of the study, new design procedures addressing sliding of the barrier, overturning of the barrier, and structural adequacy of the system were proposed. Additionally, soil reinforcement design was addressed. Bligh et al. (2010) recommended that to prevent sliding of the barrier, the following condition must be satisfied:
| (63) |
wherein ϕ is the resistance factor equal to 0.8, W is the weight of the barrier-moment slab plus any material above the moment slab, ϕr is the friction angle of the soil-slab interface, γ is the load factor equal to 1.0 for the extreme event case, and γLs is the factored equivalent static load due to the dynamic impact force, which was taken as 10 kips for TL-3 conditions. For rough soil-slab interfaces, such as the interface between soil and cast-in-place concrete, the interface friction angle is equal to the internal friction angle of the soil. Alternatively, for smooth soil-slab interfaces, such as the interface between soil and precast concrete, a reduced interface friction angle equal to two-thirds of the soil friction angle is recommended. Additionally, to prevent overturning of the barrier, the following restriction was proposed:
| (64) |
where M is the static moment resistance to overturning, and h is the distance from the application point of the lateral impact force to the rotation point, the location of which is dependent upon the design of the system. The moment resistance is calculated as
| (65) |
where l is the horizontal distance from the centroid of the barrier-slab system to the rotation point. The overturning condition is demonstrated in Figure 81.
Bligh et al. (2010) also recommended that the critical section of the coping be designed to resist any load conditions that could arise during an impact event. The coping is the component by which the traffic barrier and moment slab are connected. An example of a coping-critical
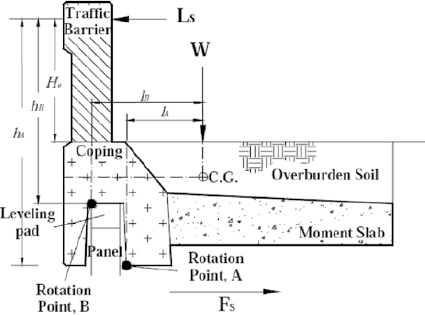
section is shown in Figure 82. Additional guidelines were proposed regarding the design of wall reinforcement and wall panels but are largely independent of the bridge rail design.
In a continuation of the research undertaken in NCHRP Report 663 (Bligh et al. 2010), Bligh et al. (2017) further developed recommendations for design guidelines of roadside barrier systems placed on MSE retaining walls for MASH TL-3 through TL-5 conditions. Following the conventions of the preceding effort, Bligh et al. proposed design guidelines addressing sliding of the barrier, overturning of the barrier, and flexural rupture of the coping. The relationships governing barrier sliding and overturning were unchanged (Equations 63 and 64). However, the recommended equivalent static load, Ls, was updated for TL-3 conditions and appended for TL-4 and TL-5 conditions. Additionally, the resistance factor was increased from 0.8 to 1.0 to reflect the extreme event case. Design values and load application guidance were proposed, as well. Recommended design values for use in barrier sliding and overturning considerations are summarized in Table 19. Bligh et al. recommend that equivalent static loads, Ls, are used for sliding and overturning evaluations, whereas dynamic loads, Ld, are used for the strength limit state of the barrier and of the coping-critical section. As in their 2010 study, Bligh et al. (2017)

Table 19. Recommended design values for barriers placed on MSE walls (Bligh et al. 2017).
| Test Designation | Ld a (kips) | Ls b (kips) | Hmin c (in.) | He d (in.) | Wmin e (ft) | BL f (ft) |
|---|---|---|---|---|---|---|
| TL-3g | 70 | 23 | 32 | 24 | 4.0 | 10 |
| TL-4-1 | 70 | 28 | 36 | 25 | 4.5 | 10 |
| TL-4-2 | 80 | 28 | >36 | 30 | 4.5 | 10 |
| TL-5-1 | 160 | 80 | 42 | 34 | 7.0 | 15 |
| TL-5-2 | 260 | 132 | >42 | 43 | 12.0 | 15 |
aDynamic load.
bEquivalent static load applied at height He calculated based on the static resistance deemed more critical for the barrier as follows: the overturning resistance for TL-3, TL-4, and TL-5-1 barriers and the sliding resistance for TL-5-2 barrier.
cMinimum barrier height.
dEffective barrier height.
eMinimum moment slab width.
fMinimum length of precast barrier.
gRevised from the recommendations of NCHRP Report 663 (Bligh et al. 2010).
addressed soil reinforcement and wall panel design, though these components are outside the scope of this review.
Little research is available in the literature for non-MSE ground-mounted railing systems. In 2019, Williams, Abu-Odeh, and Bligh (2019) utilized computer simulation to analyze a retaining wall with a bridge rail anchored to the top. The top-mounted bridge rail, shown in Figure 83, was subjected to MASH TL-4 impact conditions.
Williams, Abu-Odeh, and Bligh (2019) used LS-DYNA to estimate the stresses developed in the soil underneath the retaining wall footing due to a MASH TL-4 impact with the anchored bridge rail. The finite element analysis model is shown in Figure 84. The maximum soil pressure measured in the simulation, which included both gravity loading and dynamic impact loading, was roughly 2,880 psf (pounds per square inch). The maximum displacement measured on the anchored bridge rail was roughly 1 mm.
From the results of this simulation study, Williams, Abu-Odeh, and Bligh concluded that
- The soil was overburdened by 64%, as the maximum allowable soil pressure was 1,760 psf, and the measured soil pressure was 2,880 psf;
- Although significantly overburdened, the retaining wall remained stable, reaching a maximum lateral displacement of just 1 mm; and
- The adequacy of the system under significant overburden is likely due to the extremely short duration of the loading.
Another research effort regarding ground-mounted railings was performed at TTI by Sheikh et al. (2019). In this study, structurally independent foundations were investigated using a 36-in. single-slope traffic rail (SSTR). Designs feasible for locations allowing (1) shallow depth and wide footprint and (2) deep depth and small footprint were developed and refined using LS-DYNA. The first design was a moment slab, and the other was a concrete beam foundation.
The moment slab foundation is shown in Figure 85. This design was subjected to a MASH TL-4 crash test. The test was successful, and the system deformed minimally; the measured dynamic deflection was negligible, and there was no permanent set.

The concrete beam foundation was not tested, but a design was proposed from the results of simulated MASH TL-4 impacts. The design, shown in Figure 86, consists of concrete cylinders, spaced at 30 ft, that extend 2 ft 9 in. into the soil to anchor the system.
Bridge Rail Transitions and End Treatments
Bridge rail transitions and end treatments are used to
- Prevent direct impact with the rigid bridge rail terminal;
- Provide tensile anchorage for semi-rigid systems, such as W-beam guardrail-style bridge rails; and
- Protect errant drivers from hazards behind the approach.
Typically, bridge rail systems are significantly stiffer than the guardrail systems that approach them. Sudden changes in barrier stiffness pose severe threats to errant vehicles; a vehicle engaging

a lower-stiffness guardrail system is at risk of impacting the end of a rigid bridge rail system. Such an impact would result in extreme occupant decelerations and the potential for serious injury or fatality. To prevent this behavior, the interface between approaching systems and rigid bridge rail systems is spanned by a transition, granting a gradual change in stiffness from the approach to the bridge rail. Transition systems are often characterized by tighter post spacing, deeper beams, and increased corrugation quantities. An example of a bridge rail transition is shown in Figure 87. Similarly, the ends of rigid bridge rails without guardrail transitions pose a significant threat of direct impact. To protect against this hazard, impact attenuators can be installed where guardrail approaches are not implemented.
Semi-rigid guardrail systems, such as the MGS-compatible bridge rail (Thiele et al. 2010) and the TxDOT T631 bridge rail (Williams, Bligh, et al. 2013), rely on tensile membrane action in the beam to contain and redirect impacting vehicles. As such, these systems require approach guardrail transitions to anchor the system, rather than to prevent impact with a rigid hazard.


Additionally, approach guardrail transitions protect errant drivers from dangerous conditions behind the approach and underneath the bridge. These hazards include steep inclines off an abutment, traffic crossing underneath the bridge, water hazards, and more. When considering this role for a guardrail approach transition, the length of need must be determined using AASHTO’s Roadside Design Guide (RDG) (AASHTO 2011). Responsibility for transitions varies by agency, so some discussion would be appropriate to include in Section 13 of the AASHTO LRFD BDS to complement and refer to supplementary guidance in the RDG.
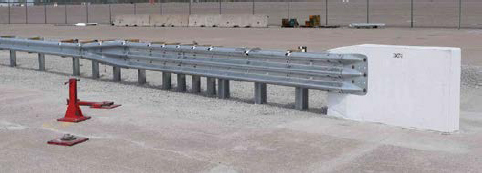
Existing AASHTO LRFD BDS Philosophy
AASHTO LRFD BDS Section 13 does not discuss the design or analysis of transitions or end treatments. However, current AASHTO LRFD BDS guidance does recommend that, in high-speed rural areas, the end of a bridge rail be treated with a crashworthy system. If an approach railing is attached to the end of the bridge rail, only a semi-rigid to rigid transition is required. If no guardrail approaches the bridge rail, however, current guidance stipulates that, in high-speed rural areas, the free end should be fastened with an impact attenuator or other crashworthy treatment. Approach railings are only required in high-speed rural areas. In urban areas, where installing approach guardrails is impossible or more difficult, alternative solutions are suggested, such as barrier curbs, speed restrictions, special signing, and recovery areas.
State of the Art
Existing AASHTO LRFD BDS guidance requires approach guardrail systems and bridge rail transitions in high-speed rural areas only. AASHTO’s RDG, however, suggests that all transitions between semi-rigid and rigid systems should be treated, regardless of locale (AASHTO 2011).
Pedestrian Railing
Pedestrian rails are installed on bridge walkways to shield pedestrians from dangerous conditions adjacent to the walkway. These systems must meet three criteria: (1) they must be tall enough to provide pedestrians with stability; (2) strong enough to support a falling pedestrian; and (3) proportioned such that it is difficult for pedestrians, especially children, to become stuck between elements. Element spacing is also specified to prevent large objects from falling from the structure. Pedestrian rails are typically post-and-beam systems, though they are occasionally supplemented by a meshing material such as chain link. Examples of pedestrian rails are shown in Figure 88.
Existing AASHTO LRFD BDS Philosophy
Pedestrian rails are not designed to redirect errant vehicles, but rather to keep pedestrians within the walkway in the event of a fall. As such, these systems are designed with a suite of stipulations independent of those used to design traffic barriers. Current AASHTO LRFD BDS guidance sets height, clearance, and strength requirements for pedestrian rails. The minimum height of pedestrian rails is 42 in. measured from the top of the walkway. Additionally, clear openings between railing elements shall not exceed 6 in. If both horizontal and vertical elements

are used to form the rail, the 6-in. opening requirement applies only to the lower 27-in. of the rail, while the upper portion’s opening requirement is increased to 8 in. For chain link or metal fabric fences, opening sizes shall not exceed 2 in. These geometric requirements are stipulated primarily to prevent children from becoming stuck in the pedestrian rail. To ensure structural adequacy, current guidance requires pedestrian rails to be designed for a live load of 50 plf (pounds per linear foot), applied simultaneously in the lateral and vertical direction at each longitudinal element, as demonstrated in Figure 89. Each longitudinal element must also be designed for a concentrated load of 200 lb acting simultaneously with the line loads at any location and in any direction at the top of the longitudinal element. Post strength is also addressed; posts must be designed for a point load, PLL, applied laterally at the upper longitudinal element. If the railing is taller than 5 ft, however, the point load is applied at a height of 5 ft. The magnitude of the point load (kips) is
| (66) |
where L is the post spacing (ft). For chain link and metal fabric fences, a 15-psf load applied normally to the entire fence surface is used for design.
State of the Art
Additional requirements not found in existing AASHTO LRFD BDS guidance are stipulated in the 2010 ADA [Americans with Disabilities Act] Standards for Accessible Design (U.S. DOJ 2010), the International Building Code (IBC) (International Code Council 2018), and the Occupational Safety and Health Administration (OSHA) (U.S. DOL 1971). Priorities in these standards differ slightly from current pedestrian bridge rail standards. Whereas AASHTO LRFD BDS guidance is concentrated on keeping pedestrians within the walkway, ADA and IBC standards provide more specific requirements aimed at creating an easily graspable rail for support when traversing stairs and ramps. Alternatively, OSHA standards primarily address worker safety in hazardous conditions.
For a pedestrian rail to be ADA- and IBC-compliant, it must be fastened with a continuous top handrail with a top edge height between 34 in. and 38 in. To ensure the top handrail is easily grasped, the ADA and IBC require that the outer diameter of a circular rail is between 1.25 in. and 2 in. For noncircular rails, the outer perimeter must be between 4 in. and 6.25 in. with cross-sectional dimensions between 1 in. and 2.25 in. (Figure 90). Perimeters greater than 6.25 in. are permissible if a graspable recess is provided.
OSHA requirements are more directly comparable to those of AASHTO Section 13. OSHA requires the height of the top edge of the handrail to be between 39 in. and 45 in. If the rail is not


secured to a wall or parapet that is at least 21 in. tall, the rail must be supplemented with midrails, screens, meshes, or pickets. Additionally, OSHA requires rails to be designed considering a 200-lb point load applied at the top edge of the rail in any outward or downward direction. Midrails, screens, meshes, and pickets must be designed to withstand a 150-lb point load acting in any outward or downward direction.
Bicycle Railing
Bicycle rails protect bicyclists using bridge walkways from dangerous conditions adjacent to the walkway. These rails are similar to pedestrian rails in their construction but are designed with slightly different considerations.
Existing AASHTO LRFD BDS Philosophy
Like pedestrian rails, bicycle rails must meet height, geometric, and strength requirements to ensure the safety of bridge users. However, due to the nature of bicycle accidents, these requirements are more restrictive than those for pedestrian rails. Current AASHTO LRFD BDS guidance requires bicycle rails on bridges designed specifically for bicycle traffic and on bridges where bicyclist protection is deemed necessary. Height and element clear opening requirements are identical to those of pedestrian rails. In applications where a high-speed impact is more likely, however, current guidance recommends a rail height above the minimum 42 in. Additionally, the inclusion of a rubrail deep enough to account for a wide range of handlebar heights is suggested, though not required. For rail heights lower than 54 in., the design loads of pedestrian rails apply. For rail heights greater than 54 in., however, it is required that the design loads be determined on a case-by-case basis by the designer. A typical bicycle rail design with a rubrail and the application of design loads is demonstrated in Figure 91.
State of the Art
While the current height requirement for bicycle rails is 42 in., an increased height of 54 in. was previously recommended from 1981 to 1999. However, the sole rationale for this guideline was the relationship between the height of the rail and the height of the bicyclist’s c.g. In 2004, Lewendon et al. conducted a research effort to evaluate the appropriateness of existing bicycle rail guidelines under NCHRP Project 20-7(168) (Lewendon et al. 2004). In the study, a survey of state DOTs, European agencies, and bicycle advocacy groups was performed, critical railing heights were determined, and new criteria were developed. Lewendon et al. concluded that a minimum railing height of 48 in. is sufficient for most applications, though a “one size fits all” approach is not realistic. In locations characterized by extreme heights, severe winds, or harsh

curvature, taller rails should be considered. However, if it is assumed an adequate rail is simply one whose height is greater than that of the bicyclist’s c.g., then a 48-in. rail is adequate for 98% of all cyclists.
Lewendon et al. also proposed guidance on applications in which bicycle rails are recommended. These applications include bicycle routes directly adjacent to vehicle traffic lanes, bike-way bridges with drop-off heights exceeding 2 ft, and paths with dangerous conditions directly adjacent, such as water bodies or rocks. An increased height of 54 in. is recommended in special cases, such as paths with curve radii inadequate for the design speed adjacent to a hazard, paths with inadequate sight distance, paths with a large number of users, and at the ends of long descents where high speeds are possible.
Motorcycle Considerations
Currently, roadside safety barriers are not explicitly designed with the safety of motorcyclists in mind. Due to the lack of protection offered by motorcycles and the unique conditions of motorcycle accidents, motorcyclists are far more vulnerable than operators of traditional passenger vehicles. However, due to the low number of motorcyclists relative to traditional vehicle operators on the roadway, little research has been conducted to lessen the severity of motorcycle accidents.
Existing AASHTO LRFD BDS Philosophy
No guidance on motorcycle containment systems is provided in AASHTO LRFD BDS. However, as current guidance allows for the implementation of crash-tested systems, motorcycle containment systems proven crashworthy in full-scale testing can be implemented without detailed analyses.
State of the Art
Motorcycle accidents can be separated into two categories: (1) the motorcyclist impacts the barrier in an upright position, potentially vaulting over the barrier, and (2) the motorcyclist impacts the barrier while sliding on the roadway surface. Each impact scenario is accompanied by unique risks to the motorcyclist. Most roadside barriers are designed with heights that are likely insufficient to prevent motorcyclists from vaulting over the barrier in the event of an upright impact.

Addressing the issue of vaulting in upright collisions, Silvestri-Dobrovolny et al. (2019) conducted a research effort to design a containment system for errant motorcyclists. With the aid of finite element simulations in LS-DYNA, a chain link containment system that can be secured to the top of existing concrete barriers was designed. A full-scale crash test was performed on the system in which the surrogate motorcyclist was contained and subjected to safe head accelerations and a relatively gentle crash sequence. The system and sequential photographs of the crash test are shown in Figure 92. The combined system has not yet been crash tested to MASH criteria, though TL-3 testing was recommended.
If the motorcyclist impacts the barrier while sliding on the roadway surface, different risks are encountered. Particular risks arise when a sliding motorcyclist impacts a post-and-beam system, as penetration or direct impact with posts is possible. For this reason, AASHTO’s RDG suggests that solid concrete parapets are better suited for motorcycle impacts than post-and-beam systems (AASHTO 2011). European and Australian agencies have developed methods to evaluate motorcyclist safety in sliding impacts (LIER 1998; AENOR 2008; AS/NZS 2015). Additionally, in 2008, the European Road Assessment Programme (EuroRAP) provided an overview of motorcycle-friendly guardrail systems, including lower secondary rails and alternative post designs (EuroRAP 2008). One potential safety improvement involves the installation of metal rails or plastic tubes between posts, which create a continuous rail face and prevent motorcyclists from impacting posts.
Alternatively, posts can be designed with rounded edges to reduce the severity of impacts. Traditional, I-shaped posts often result in severe injuries when impacted by motorcyclists, including limb amputations and bone fractures. In response to this safety concern, an increasing number of guardrail systems in Europe are designed using sigma-shaped posts, rather than the typical I-shaped post. This alternative post design has been shown to result in injuries of lower severity when impacted (Schmidt 1985). Additionally, in the United Kingdom, Z-shaped posts are common, though no research has been performed to evaluate the safety benefits of this design.
In areas of particular danger to motorcyclists, such as on sharp curves, impact attenuators can be installed to shield individual posts (EuroRAP 2008). These installations can be easier to install and more cost-effective than more expansive solutions, such as secondary rails or alternative post designs.
Design and Analysis of Bridge Deck Overhangs
The integrity of any bridge rail system is heavily dependent upon the deck structure to which it is secured. The design of the deck structure is ultimately of equal importance to that of the bridge rail, as either can limit the strength of the overall system in the event of a vehicle impact.
Deck parameters affecting bridge rail behavior include thickness, reinforcement, anchorage design, and material. Additionally, due to their footprints, solid parapet and post-and-beam systems are characterized by deck interactions that are unique from one another.
The bridge deck overhang, or the cantilevered portion of the bridge deck protruding from the outermost girder, is particularly sensitive to railing impacts. As such, the design of the deck overhang is described in AASHTO LRFD BDS Section 13. A typical bridge deck overhang is demonstrated in Figure 93.
Design Cases
Bridge deck overhangs are subjected to a suite of loads varying in their direction of application, likelihood, and severity. As such, the design of bridge deck overhangs requires consideration of multiple load cases. Lateral impact loads, vertical impact loads, and wheel loads occupying the overhang region all pose potential threats to the integrity of the bridge deck.
Existing AASHTO LRFD BDS Philosophy
Current AASHTO LRFD BDS guidance specifies three design cases by which deck overhangs must be analyzed. These cases address the variety of demands to which deck overhangs are subjected and include (1) transverse (Ft) and longitudinal forces developed in vehicle impacts with bridge rail, (2) vertical forces (Fv) developed in vehicle impacts with bridge rail, and (3) vehicle wheel loads occupying the overhang region. Cases are considered independently, though dead loads produced by the barrier, deck slab, and wearing surface should be considered in each case.
Design Case 1, which considers impact forces acting in the plane of the deck, is considered an extreme event and is subject to the conditions of AASHTO extreme event load combination II. Design Case 1 is demonstrated in Figure 94.
Design Case 2 follows the conventions of the preceding case but considers vertical impact forces. Design Case 2 is demonstrated in Figure 95.
Alternatively, Design Case 3 does not consider barrier impact loading. Instead, this case addresses the vehicle wheel loads occupying the overhang region at any point in time. As such, Design Case 3 is independent of bridge rail impact considerations.

State of the Art
In a 2016 investigation of bridge deck overhang design, Frosch and Morel provided additional guidance for applying the design cases found in current AASHTO LRFD BDS guidance (Frosch and Morel 2016). Frosch and Morel proposed that, for Design Case 1, two critical sections should be evaluated: (1) the deck section coincident with the face of the rail, and (2) the deck section coincident with the critical girder section, where the critical girder section is determined in AASHTO Article 4.6.2.1.6. For example, the critical section of an overhang on a concrete box is at the face of the box, and the critical section of an overhang on a precast I-shaped concrete beam is at one-third of the flange width inset from the outer face of the flange. Alternatively, for Design Case 2, the deck section coincident with the rail face does not require analysis, as the vertical impact force acts at a very small moment arm. When considering Design Case 2, Frosch and Morel applied the vertical impact load at the outermost edge of the bridge rail. These guidelines are demonstrated in Figure 96.

Decks Supporting Concrete Parapet Rails
Solid concrete bridge rails are secured to bridge decks along a continuous face. As such, when an errant vehicle impacts a solid concrete bridge rail, impact forces penetrate downward into the barrier, eventually reaching the deck and exerting distributed flexural and tensile demands on the overhang. To properly design a solid concrete bridge rail system, the manner in which impact forces travel through the barrier and into the deck must be carefully considered.

Existing AASHTO LRFD BDS Philosophy
Current AASHTO LRFD BDS guidance indicates that the deck overhang should be designed to resist a unit-length flexural demand, Ms, acting coincident with a unit-length tensile force, T. The overhang design moment, Ms, may be assumed equal to the bending strength of the concrete barrier about its longitudinal axis at its base, Mc. The unit-length tensile force acting on the overhang section (k/ft) is calculated as
| (67) |
where Rw is the yield-line capacity of the barrier. The magnitude of lateral deck tension calculated in existing guidance assumes that barrier shear fans outward at a 45o angle as it penetrates downward through the barrier. If the deck overhang capacity does not meet the aforementioned

requirements, AASHTO LRFD BDS suggests that the expected yield-line failure mechanism may not develop in the barrier. No further guidance is provided for deck overhangs supporting concrete parapets.
State of the Art
Current AASHTO LRFD BDS guidance suggests that deck overhangs may be designed such that they can resist a longitudinal-axis moment, Ms, which is greater than or equal to Mc at the base of the parapet. Such a practice neglects the actual demand imposed on the deck overhang in favor of a highly conservative estimate, which considers the maximum possible demand. As such, this philosophy can result in significantly overdesigned deck overhangs.
Many tests, both static and full-scale, have been performed on deck overhangs with lower strength than the barriers they support. It is common in these scenarios for the deck to not only perform adequately but to suffer very little damage, as shown in Table 20. This list is not exhaustive, as barrier and deck strengths are not typically published in crash-test documentation reports. Alberson et al. (2005) performed three static load tests on full-scale concrete bridge rail specimens at both interior and end conditions. In each test, the bending strength of the deck was significantly less than Mc at the parapet base. The load test results indicated that a deck flexural capacity less than the flexural capacity of the parapet at its base is permissible. Alberson et al. (2005) proposed that yield-line mechanisms can occur in the barrier even for deck bending strengths as low as 45% of Mc at the parapet base. Additionally, in a TL-5 bridge rail design effort, Rosenbaugh et al. (2016) designed the deck overhang for 85% of Mc. In the full-scale MASH TL-5 crash test on the system, the deck sustained only minor cracking at a free corner. The results of this test are consistent with the findings of Alberson et al. (2005): deck overhangs with a capacity less than Mc can perform adequately. The results of this synthesis indicate a clear trend; decks designed with a flexural capacity less than Mc are often sufficient, suffering only minor damage under test loads. The literature does not provide a single reduction factor on Mc that would be universally adequate, however, because the relationship between the deck and barrier capacity is complex. The sufficient ratio of deck-to-barrier strength is affected by Rw, Mw, and likely also the added vertical and torsional stiffness and associated longitudinal load distribution that bridge rails provide to the free edge of deck overhangs.
Table 20. Summary of tests performed on decks with less flexural capacity than barrier.
| Specimen | Test | Test Level | Design Strength (kips) | Failure Strength (kips) | Deck Damage | |
| F-Shape Barrier (Alberson et al. 2005) | Static | 4 | 73 | 0.74 | 64 | Minor cracking |
| F-Shape Barrier (Alberson et al. 2005) | Static | 4 | 104 | 0.74 | 104 | None |
| F-Shape Barrier (Alberson et al. 2005) | Static | 4 | 104 | 0.45 | 104 | Minor cracking |
| Optimize Concrete Rail (Rosenbaugh 2019) | Full-scale | 4 | 80 | 0.91 | — | None |
| Manitoba Tall Wall (Rosenbaugh et al. 2016) | Full-scale | 5 | 266 | 0.85 | — | Hairline cracking |
| F-Shape Barrier (Rosenbaugh et al. 2016) | Full-scale | 5 | — | 0.85 | — | None |
| Vertical Parapet (Rosenbaugh et al. 2016) | Full-scale | 5 | 205 | 0.71 | — | None |
| Open Concrete Rail (Rosenbaugh et al. 2016) | Full-scale | 5 | — | 0.47 | — | Minor spalling |
NOTE: — = not applicable.
An alternative design philosophy has grown in popularity with state DOTs and roadside safety agencies in the absence of a clear prescriptive Ms/Mc design ratio. In this philosophy, a lateral force is used to determine the flexural demand in the deck. Multiple versions of this method exist; some use the lateral capacity of the barrier, Rw, whereas others use a factored impact load, βFt.
The Washington State Bridge Design Manual (WSDOT 2019) from the Washington State Department of Transportation (WSDOT) documents the use of this technique. WSDOT recommends that the design moment is determined as the moment produced by the flexural resistance of the barrier acting at the full barrier height distributed at a 45o fanning angle. Additionally, WSDOT documentation specifies flexure and tension design values at end segments. This method is similar to the current AASHTO LRFD BDS method, as it employs the resistance of the barrier but accounts for the overall resistance of the barrier, rather than Mc alone. However, this practice could likewise result in overdesigned deck overhangs if Rw is in far excess of Ft. Overhang design values recommended by WSDOT are
| (68) |
Similarly, other state DOTs use a factored impact load, βFt, to estimate the deck overhang demand. Common load factors, β, are 1.20 and 1.33. An unfactored (i.e., β = 1) Ft was used to design an optimized TL-4 concrete bridge rail at MwRSF in Rosenbaugh 2019. In this design, the effective height proposed in NCHRP Web-Only Document 326 was used as the impact force’s moment arm, rather than the full height of the barrier (similar to WSDOT, but substituting He for H in the numerator of Ms equations) (Bligh et al. 2017). This design philosophy resulted in a system with a deck overhang whose strength was 91% of the barrier strength (Ms/Mc = 0.91). The system was tested to MASH TL-4 criteria, and the deck overhang sustained no damage.
In summary, there are three philosophies by which deck overhangs can be designed:
- Designing for the full strength of the barrier, Mc;
- Designing for a factored strength of the barrier, αMc, where α < 1.0; and
- Designing for a lateral force, either Rw or βFt, which creates a moment in the overhang.
Designing for the full strength of the barrier is the simplest method, but this philosophy can result in significantly overdesigned overhangs if Mc is not developed in an impact event. Tests were identified in the literature that suggest that deck overhangs weaker than the barrier can perform adequately, sustaining little to no damage while keeping failure mechanisms in the barrier. However, the data is limited, and a universal prescriptive factor is not available. As such, the third philosophy in which a lateral force is used to estimate the moment demand in the overhang is the most promising of the existing methods. If the impact force, Ft, is used, this method estimates the actual demand that will be imposed on the overhang rather than the maximum possible demand. As such, it best reflects an actual impact event and is less likely to result in significantly overdesigned decks. An overstrength factor, β, can be applied to the impact force to more strongly encourage failure in the barrier, rather than the deck, to reduce the likelihood of deck overhang damage.
The preceding discussion considers only design section 1-1, which is coincident with the parapet face (Frosch and Morel 2016). Contemporary research efforts have described in greater detail the transmission of impact loads from the barrier into the deck overhang. The AASHTO-prescribed 45o shear fanning angle continues to be used, and no alternatives have been proposed (PCI 2014; Frosch and Morel 2016; Rosenbaugh 2019). AASHTO LRFD BDS provides no guidance on the distribution of lateral deck tension as it travels from the face of the parapet to the face of the supporting element, though it is suggested that post-and-beam demands distribute

at a 45o angle as they penetrate inward. Some designers extend this guidance to solid parapet systems (Wassef et al. 2003). However, the Precast/Prestressed Concrete Institute Bridge Design Manual (PCI 2014) suggests that deck demands distribute at a 30o angle with penetration into the deck, as demonstrated in Figure 97. This guidance has been used in several studies, including a deck overhang design investigation (Frosch and Morel 2016), a TL-4 bridge rail design effort (Rosenbaugh 2019), and an adequacy evaluation of an in-service bridge rail system (Loken et al. 2019). This transmission is demonstrated for end conditions in Figure 98.
Based on existing design principles, Frosch and Morel (2016) suggested that the longitudinal-axis impact moment distributes through the deck in the same manner as lateral deck tension. As such, Frosch and Morel proposed that the flexural demand acting at the deck section coincident with the supporting element critical section is
| (69) |
where M2-2 is the design moment at design section 2-2, M1-1 is the design moment at design section 1-1, and D is the distance between the two design sections. M1-1 would be determined using the methods described above.
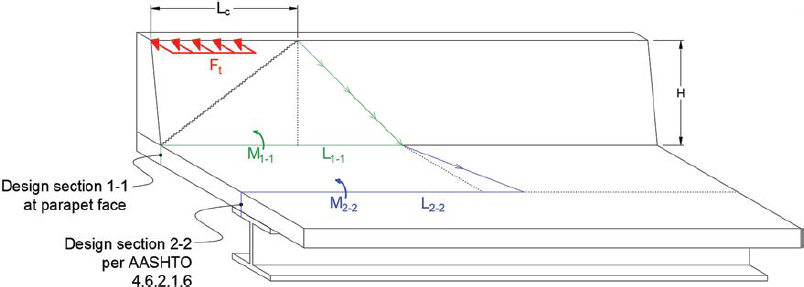

Further, based on the results of an experimental testing program, Frosch and Morel (2016) concluded that barrier impact loads are distributed over large distribution lengths far in excess of those recommended by current guidance. Impact loads were found to be resisted by deck overhang lengths of at least 10Lt. In light of this finding, Frosch and Morel suggested that deck overhang structures do not need to be designed for lateral impact loads and that existing transverse reinforcement required by AASHTO LRFD BDS is excessive. However, although the deck length to which lateral impact loads were transferred was drastically longer than that described in current guidance, the deck overhang specimen sustained significant longitudinal cracks. A post-test deck overhang specimen with longitudinal cracking is shown in Figure 99.
Current deck demand estimates rely on a presupposition that the barrier strength is controlled by yield-line flexure mechanisms. However, as recent studies have suggested that barrier strength is instead limited by punching shear (Alberson et al. 2005; Frosch and Morel 2016; Sennah et al. 2018), deck demands exerted in a punching shear failure mechanism may be more appropriate to consider. In an evaluation of an in-service bridge rail system, Loken et al. (2019) assumed that demands related to the punching shear mechanism distribute at 45o from the lower edge of the failing block. This behavior is shown in Figure 100.
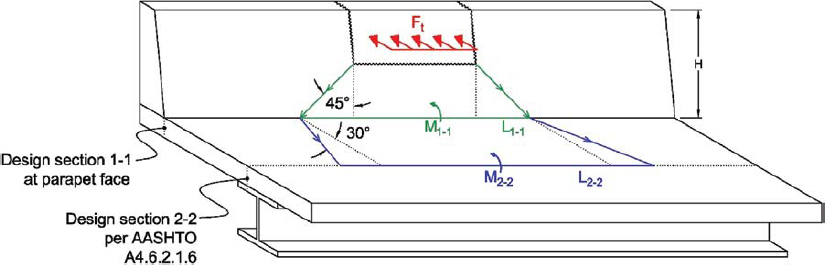
Arnold and Hirsch (1985) investigated methods of improving the behavior of concrete deck overhangs supporting solid concrete parapets. Four static load tests were performed on a TxDOT T5 solid concrete parapet secured to a concrete deck overhang designed in accordance with the AASHTO Interim Specifications to Standard Specifications for Highway Bridges, 12th edition (AASHTO 1979). The base design, from which behavior was referenced and improved upon, is shown in Figure 101. When loaded statically, the standard T5 system failed at 45 kips. Damage was concentrated in the deck slab, with severe diagonal cracking at the deck-to-barrier interface and only minimal damage in the rail. Damage to the original system is shown in Figure 102.
The first modification to the system proposed by Arnold and Hirsch was extending the transverse deck bars to within 1 in. of the field edge of the slab and removing the nontraffic-side leg of the U-bar anchoring the barrier to the deck. Additionally, the nontraffic side of the barrier was chamfered to reduce prying action, effectively increasing the edge distance from 1.5 in. to 3.5 in. This modified design was statically loaded to a reduced peak load of 36.2 kips. Cracking in the slab remained severe.
Next, Arnold and Hirsch added an angled stirrup to span the deck-to-barrier joint where failure occurred in the original load test (Figure 102). This addition, demonstrated in Figure 103, resulted in a capacity of 42.2 kips.
The final design analyzed by Arnold and Hirsch was the modified T5 without the angled stirrup on a 10-in.-thick deck overhang. This design, shown in Figure 104, was tested to failure at a load of 49.1 kips. Severe cracking occurred along the vertical anchor bar and along a 45° plane at the interface, similar to the damage shown in Figure 102. Hairline cracking also formed at the neck where the overhang thickness pinched from 10 in. to 8 in.
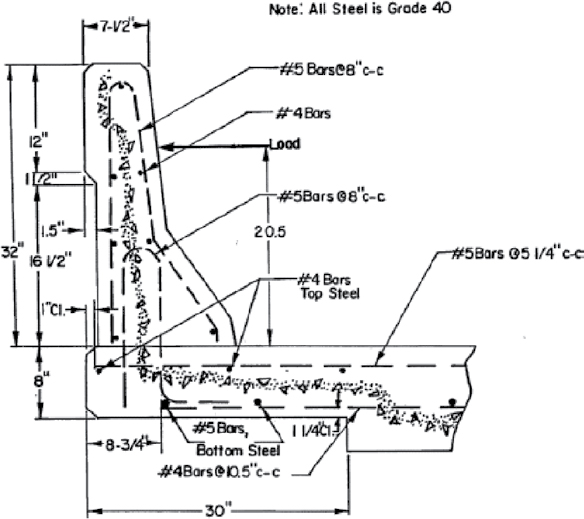
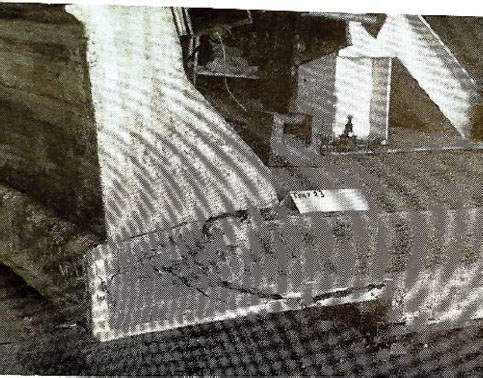


The results of this testing series led Arnold and Hirsch to the conclusion that the original T5 bridge rail was the most practical design. Additionally, Arnold and Hirsch drew conclusions about the modifications that increased or decreased the capacity of the bridge rail and overhang system. Modifications that increased the capacity of the system included
- Adding a 45° stirrup under the barrier, as shown in Figure 103, and
- Increasing the deck overhang thickness.
Modifications to the solid concrete parapet system resulting in reduced or unchanged capacity are as follows:
- Exchanging a two-legged U-bar anchor for a one-legged anchor, demonstrated by a comparison of Figure 101 to Figure 103, and
- Adding a chamfer to the nontraffic-side base of the barrier, as demonstrated in Figure 103.
Decks Supporting Post-and-Beam Rails
In contrast with the continuous footprint of concrete parapets, post-and-beam bridge rails are secured to the deck in a discrete fashion. Consequently, rail forces produced in vehicular impacts are effectively exerted as concentrated loads onto the bridge deck overhang. Collisions with post-and-beam railings can impose large forces at post attachment points.
Existing AASHTO LRFD BDS Philosophy
As metal post-and-beam rails exert point loads on the deck overhang structure, AASHTO LRFD BDS design values corresponding to Design Case 1 differ significantly from those of concrete parapets. The flexural demand, Md, and tensile demand, T, per unit length are determined as
| (70) |
| (71) |
in which Mpost is the plastic moment resistance of a single post, Pp is the shear force on a single post, Wb is the width of the baseplate, and db is the distance from the outer edge of the baseplate to the innermost row of bolts. Additionally, punching shear failure of the deck becomes an important consideration in Design Case 2. The punching shear force and overhang moment are calculated as
| (72) |
| (73) |
where L is the post spacing, X is the distance from the outside edge of the post baseplate to the evaluated overhang section, and b is the length of the evaluated overhang section onto which Md is exerted.
| (74) |
The portion of the deck overhang resisting impact loads exerted through a post-and-beam system is demonstrated in Figure 105.
The factored resistance of the deck overhang to punching shear is calculated as the product of shear resistance of the concrete provided by tensile tresses, vc, the critical perimeter, and the overhang thickness, h
| (75) |
where ϕ is equal to 1.0, E is the distance from the edge of the slab to the centroid of the compressive stress resultant in the post, and B is the distance between centroids of tensile and compressive
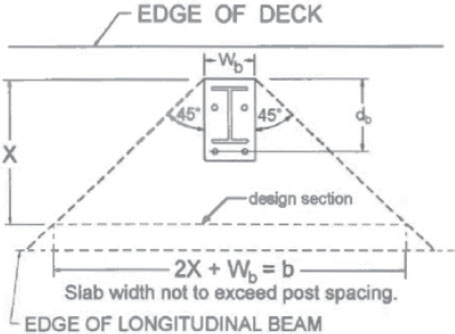
stress resultants in the post. The punching shear critical perimeter is demonstrated in Figure 106. The shear resistance of the concrete is calculated as
| (76) |
in which βc is the ratio of the long side to the short side of the load or reaction area.
The factored resistance to punching shear must be greater than or equal to the shear demand, which is calculated as
| (77) |
wherein Af is the area of the post compression flange, Fy is the yield stress of the post compression flange, and Lv is the distribution length of vertical force Fv.
State of the Art
Methods of improving the behavior of concrete deck overhangs supporting post-and-beam bridge rails were investigated by Arnold and Hirsch (1985). In an expansive testing series of different rail and deck configurations, Arnold and Hirsch investigated both metal post-and-beam systems and open concrete rails.
To investigate metal post-and-beam systems, a total of two dynamic pendulum tests and eight static loading tests were conducted on the TxDOT T101 strong post, W-beam bridge rail secured to a concrete deck overhang. The TxDOT T101 rail secured to a standard bridge deck is shown in Figure 107 alongside its standard anchorage plate assembly.
After determining the strength of the post when secured to a rigid base and to a bolted anchor plate, Arnold and Hirsch performed two static tests on the standard T101 rail. The deck overhang was 7.5-in. thick and was designed in accordance with AASHTO Interim Specifications to Standard Specifications for Highway Bridges, 12th edition (AASHTO 1979). In both tests, the concrete deck overhang failed in punching shear, as demonstrated in Figure 108. Peak loads at failure were 18.6 kips and 19.0 kips in the first and second tests, respectively.
The standard TxDOT T101 rail and deck overhang were then subjected to two dynamic impact tests with pendulums equipped with a rigid and a deformable nose. Cracking patterns


were identical to those of the preceding static tests, indicating punching shear failure of the deck overhang. Peak loads of 57.9 kips and 36.2 kips were measured in the rigid- and deformable-nose pendulum tests, respectively. The results of the static and dynamic tests on the standard 7.5-in.-thick overhang indicated an insufficiency of deck overhangs designed to 1979 AASHTO specifications.
Arnold and Hirsch (1985) hypothesized that the failure of the deck overhang was due to high-stress concentrations at the post anchorage. In response to this insufficiency, an alternative deck design was developed and tested. The alternative deck design featured a welded wire mat placed above the top layer of slab reinforcement and additional transverse and longitudinal bars in the top layer of reinforcement. This configuration was statically tested with a 7.5-in.-thick deck slab and with a 10-in.-thick deck slab. Failure loads were increased significantly from the standard deck design, with the 7.5-in. slab failing at 24.0 kips and the 10-in. slab failing at 27.0 kips. Cracking patterns at failure were again consistent with punching shear. Modifications made for these tests are shown in Figure 109.


Although the capacity of the deck overhang was increased with the alternative deck design, Arnold and Hirsch sought a more economical design. The welded wire mat was removed, and one longitudinal bar was removed from the top layer of reinforcement. The capacity lost with these modifications was recovered with an enlarged post anchor plate, shown in Figure 110. This configuration was statically tested with an 8-in.-thick deck slab and with a 10-in.-thick deck slab. Capacities were similar to those of the previous configuration, with the 8-in. deck configuration failing at 21.4 kips, and the 10-in. deck configuration failing at 21.2 kips. Damage to the 8-in. deck configuration was consistent with punching shear failure, but damage to the 10-in. deck configuration was localized to the bolt holes on the field side of the rail.
The final modification to the T101 rail tested by Arnold and Hirsch was an increased post edge distance (dimension E in Figure 106). Post edge distance was increased from 1.75 in. to

3.50 in., and one embedded anchor plate was reduced in size, as shown in Figure 111. This configuration was tested with deck thicknesses of 8 in. and 10 in. in which capacities of 22.0 kips and 25.4 kips, respectively, were measured. Although the capacity was not significantly increased, failure mechanisms were much more favorable, with concrete cracking occurring only about the field-side bolt holes and in the edge of the deck. Punching shear failure did not occur. Instead, bolt failure governed the system strength, and deck damage was significantly reduced.
To investigate open concrete rails, Arnold and Hirsch performed testing and analysis on the TxDOT T202 open concrete rail. A 7.5-in. concrete deck overhang designed to AASHTO 1979
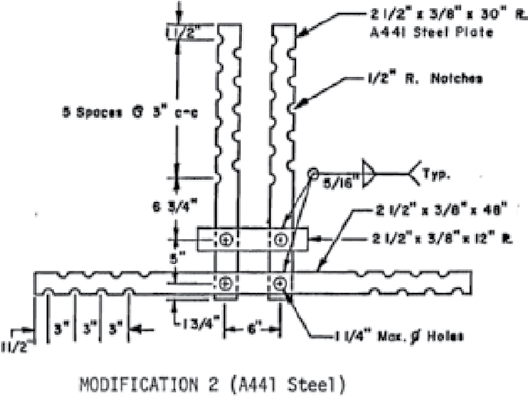

specifications was secured with the standard TxDOT T202 concrete rail (Figure 112) and subjected to one static and one dynamic load test. The load at failure in the static test was 26.3 kips; the maximum load measured in the dynamic test was 109 kips. In both tests, severe cracking and spalling of the deck overhang were observed, consistent with a punching shear mechanism. In the static test, the concrete beam fractured on both beam-to-column joints at posts adjacent to the loaded post, as shown in Figure 113. Minimal damage was sustained by the posts.
To encourage damage in the post rather than in the deck, Arnold and Hirsch increased the strength of the deck by adding a welded wire mat to the top layer of slab reinforcement and

lengthening the top and bottom reinforcement to within 1 in. of the slab edge. This modification resulted in virtually no differences in the capacity or behavior of the bridge rail system. Next, Arnold and Hirsch added an 8-in. lap splice to the tension and compression steel beginning on top of the deck, as shown in Figure 114. This modification did not increase the capacity of the bridge rail but resulted in significantly less damage at failure, effectively eliminating the extreme spalling of the deck slab observed in previous tests. An additional test was performed on this modified system with an enlarged wire mat, but the behavior of the system was unchanged. As such, Arnold and Hirsch concluded that the addition of a wire mat provided no additional strength and therefore removed the mat from the design.
Arnold and Hirsch further modified the system by extending the nontraffic-side vertical reinforcement in the post through the entire deck slab, rather than lapping it with a bar extending from the deck slab as in previous designs. Two longitudinal bars at the top and bottom of the deck slab were added to better confine this vertical bar within the deck. A stirrup was added in the deck connecting the top and bottom steel at this joint. Additionally, the upper reinforcement in the deck slab was bent upward into the post and lapped with the traffic-side vertical reinforcement in the post. This configuration, shown in Figure 115, was statically tested with an 8-in. deck and a 10-in. deck. Loads measured at failure were 24.9 kips and 31.0 kips, respectively. Damage at failure was more favorable for the 10-in. deck, with severe cracks appearing in the post along the 12-in. lap splice before damage appeared in the deck slab.
To further improve the behavior of the deck overhang, Arnold and Hirsch increased the traffic-side lap splice from 12 in. to 17 in. and increased the post edge spacing from 1.5 in. to 3.5 in. Two longitudinal bars were added between the nontraffic-side vertical steel and the field edge of the deck. This configuration was tested on an 8-in. deck and a 10-in. deck, with measured failure loads of 23.4 kips and 29.2 kips, respectively. No concrete spalling was observed, and cracking was concentrated about the posts; deck damage was reduced significantly.


This design, which was considered favorable, was simplified by removing the stirrup between the longitudinal bars confining the post’s vertical compression steel and straightening the deck slab’s transverse steel. The simplified design, demonstrated in Figure 116, was tested on an 8-in. deck and a 10-in. deck, with measured failure loads of 35 and 40 kips, respectively. Although the simplified design had a higher capacity, damage to the deck was more severe, with significant cracking in the slab. Spalling remained minimal, however, leading Arnold and Hirsch to declare this design to be the most favorable of the testing suite.

In sum, Arnold and Hirsch proposed modifications that improved bridge rail capacities and reduced damage to decks supporting post-and-beam rails. Modifications to metal post-and-beam systems resulting in improved behavior are as follows:
- Extending transverse steel nearer to the field edge of the deck slab.
- Increasing the number of longitudinal bars between the anchor bolts and the field edge of the deck slab.
- Adding welded wire mesh underneath the posts.
- Enlarging the post anchor plate.
- Increasing the post edge distance.
- Increasing the deck slab thickness.
Modifications to open concrete rails resulting in improved behavior are as follows:
- Extending transverse steel nearer to the field edge of the deck slab.
- Increasing the post edge distance.
- Increasing the deck slab thickness.
- Adding additional longitudinal slab reinforcement about the deck-to-post joint.
An alternative method of estimating the resistance of deck overhangs supporting post-and-beam bridge rails was described in a research effort performed by Mander et al. (2011). To account for two-way slab action and incomplete transverse bar development, Mander et al. developed an overhang yield-line method informed by a review of design standards and overhang load tests. The research team suggested that the behavior of concrete overhangs is more aptly described as a two-way slab, rather than a simple cantilever. As such, the capacity of concrete overhangs is more accurately estimated using a yield-line approach. Yield-line theory, as applied to concrete overhangs, is demonstrated in Figure 117. According to Mander et al., the traditional mechanism is not strictly accurate. For the traditional mechanism to occur, all bars along the hinge lines must yield to the edge of the slab. As the edge of the slab is approached, bar embedment lengths become insufficient to fully develop the strength of the steel. As such, Mander et al. modified traditional yield-line theory to address the reduction in flexural capacity resulting from underdeveloped steel near the slab’s exterior face.
Mixed shear-flexure failures were shown to occur when overhang specimens were loaded near transverse seams in experiments performed by Mander et al. (2009) and Trejo et al. (2008). Specimens simulating both conventional (Figure 118a) and recently developed, full-depth (Figure 118b) overhangs were loaded under quasi-static conditions to investigate the effect of transverse seams on overhang behavior. The results of these tests suggest that, when full-depth overhangs are loaded near the transverse seam, shear failure at the seam significantly affects the overhang capacity.
To address the behavior of full-depth overhangs observed in previous tests, Mander et al. (2011) further modified the yield-line mechanism to account for shear action at partial-depth transverse
seams. Additionally, to evaluate the accuracy of the mechanism accounting for incomplete bar development and the mechanism accounting for seam shear failure, a series of quasi-static load tests were performed on conventional and full-depth overhang specimens. The testing suite is described in Figure 119.
In Load Case 1.3, a conventional overhang was loaded and analyzed using the yield-line mechanism accounting for incomplete bar development near the slab edge. In Load Cases 1.6, 2.3, and 2.7, full-depth overhangs were loaded and analyzed using the yield-line mechanism accounting for both incomplete bar development and shear-flexure interaction. The mixed shear-flexure failure mechanism for Load Case 2.7 is demonstrated in Figure 120.
The results of the testing suite showed marked improvements over both the traditional yield-line mechanism and AASHTO LRFD BDS capacity estimates. Experimental failure loads and theoretical capacity estimates for each load case are shown in Table 21. For the single-point load experiments (Load Cases 1.3, 1.6, and 2.7), the modified yield-line mechanisms proposed by Mander et al. (2011) estimated the capacity of the overhang specimens more accurately


than traditional yield-line theory or AASHTO LRFD BDS punching shear guidance. For Load Cases 1.3, 1.6, and 2.7, modified capacity estimates were 19%, 5%, and 18% nearer to the failure load than existing AASHTO LRFD BDS estimates, respectively.
A flexural failure consistent with the yield-line mechanism proposed by Mander et al. (2011) was observed in full-scale crash testing performed by Williams, Menges, and Griffith (2019). The system, a strong post, two-tube metal rail secured to a concrete bridge deck, experienced flexural failure at the slab’s free corner in both the MASH 4-11 and MASH 4-12 crash tests. Damage to the system is shown in Figure 121. Damage observed in this testing series may also suggest that the deck slab acts as a torsional beam, though this assumption is based only on observation and has not been investigated.
Unconventional Decks
Most bridge rail systems are secured to steel-reinforced concrete overhangs. However, unconventional deck materials, though uncommon, are available for use. Unconventional deck types include timber decks, composite decks, and inverted tee concrete decks.
Existing AASHTO LRFD BDS Philosophy
No guidance for the attachment of bridge rails to unconventional deck systems is provided in the current AASHTO LRFD BDS. However, timber decks are discussed in AASHTO LRFD BDS Section 9.9. The second edition of AASHTO LRFD Bridge Design Guide Specifications for GFRP-Reinforced Concrete with Errata (AASHTO 2020b) refers to A13.4.1 in the AASHTO LRFD BDS (2020a).
Table 21. Comparison of modified yield-line analysis to traditional methods (Mander et al. 2011).
| Load Case | Experimental Failure Load (kN) | Yield-Line Theory (kN) | Modified Yield-Line Theory (kN) | AASHTO Punching Shear (kN) | Mixed Flexural-Shear Failure (kN) |
|---|---|---|---|---|---|
| 1.3 | 476 | 630 (0.75) | 526 (0.90) | 668 (0.71) | — |
| 1.6 | 374 | 610 (0.61) | 472 (0.79) | 534 (0.70) | 378 (0.99) |
| 2.3 | 360 | 356 (1.01) | 338 (1.06) | 534 (0.67) | 481 (0.75) |
| 2.7 | 302 | 605 (0.50) | 396 (0.76) | 534 (0.57) | 320 (0.94) |
NOTE: Terms in parenthesis indicate the ratio of experimental failure load to estimated capacity.

State of the Art
GFRP-Reinforced Concrete Bridge Decks
No literature was identified documenting MASH crash testing of bridge rails secured to GFRP-reinforced concrete deck systems. Buth et al. (2003) reported on two crash tests performed according to NCHRP Report 350 test designation 3-11 in which the deck was GFRP-reinforced. Deck damage was either negligible or marginal after the tests. Matta and Nanni (2009) reported on quasi-static experiments with GFRP-reinforced open concrete railings and deck, as shown in Figures 122, 123, and 124. The GFRP deck reinforcing used by Matta and Nanni incorporated a stay-in-place form system in addition to reinforcing bars. The authors concluded that the “railing design implemented was shown to meet the global strength requirement of 44.5 kN per AASHTO 2002 Standard Specifications when undergoing very small deformations, which is typical of crashworthy RC [reinforced concrete] railings.” The concrete post-and-deck system was limited by the connection capacity, particularly corner breakout. The AASHTO LRFD Bridge Design Guide Specifications for GFRP-Reinforced Concrete Bridge Decks and Traffic Railings (AASHTO 2009a) reflects contributions from the work by Matta and Nanni (2009) with requirements to address corner breakout (A5.1.2) and analytically account for equilibrium and compatibility (A5.3.1).


Ahmed, Matta, and Benmokrane (2013) reported on quasi-static experiments performed similarly to Matta and Nanni with respect to the general experimental setup (see Figure 125). Ahmed, Matta, and Benmokrane (2013) were distinct from Matta and Nanni (2009) in that: (1) tests were performed on both steel-reinforced deck benchmark specimens and GFRP-reinforced specimens (see Figure 126); (2) the GFRP-reinforced deck was a more typical system, reinforced only with bars (no stay-in-place form); (3) the railing was steel post-and-beam with two posts per specimen; (4) the posts were mounted to the top of a concrete curb; and (5) the design provided more substantial capacity—approximately 100 kN per post for Performance Level (PL)-2 according to 2006 Canadian Standards rather than 44.5 kN required by AASHTO 2002 Standard Specifications. Figure 125). Ahmed, Mata, and Benmokrane (2013) obtained similar results and reached similar conclusions to Matta and Nanni. The GFRP-reinforced systems generally performed adequately compared to the steel-reinforced benchmark systems, and corner breakout was similarly noted as a critical limitation. Ahmed, Matta, and Benmokrane (2013) noted that deformations are larger with the GFRP-reinforced system because of the lower elastic modulus of GFRP relative to steel, which could potentially compromise crashworthiness in a full-scale test.
Timber Bridge Decks
Only one bridge rail system secured to a timber deck has been performed to MASH criteria. In 2009, researchers at MwRSF conducted component and full-scale crash testing of a TL-1

timber bridge rail attached to a transverse nail-laminated timber bridge deck with a concrete overlay, as shown in Figure 127 (Rosenbaugh et al. 2009). From the component testing suite, it was determined that toothed shear connectors, which are designed to distribute shear forces across multiple planks (1) provided negligible increases in strength, (2) resulted in more severe deck damage, and (3) increased labor and material costs associated with system installation. As such, Rosenbaugh et al. advised against the use of shear connectors on the transverse timber deck. Full-scale crash testing validated the system as adequate to MASH TL-1 criteria.
Analysis of systems secured to timber decks to MASH criteria is uncommon. However, several bridge rails secured to timber decks were successfully tested to NCHRP Report 350 criteria by researchers at MwRSF, ranging from TL-1 to TL-4 (Polivka et al. 2002; Polivka et al. 2003; Hitz et al. 2006; Faller and Rosson 1997).
Composite Bridge Decks
Research efforts have been conducted to investigate the behavior of composite bridge decks supporting bridge rail systems. Stolle et al. (2007) developed a precast New Jersey Safety Shape bridge rail for use on composite decks. The barrier was anchored to the deck with 1-in.-diameter anchor bolts inserted through a steel pipe and into the deck in an anchorage assembly similar to the British Columbia Ministry of Transportation (BC MoT) system, illustrated later in Figure 142 (Bleitgen and Stiemer 2006). The FRP bridge deck panels were placed transversely across steel bridge girders, and panel surfaces were fabricated using 0.5-in.-thick elements composed of 40% fiberglass and 60% polyester. The test specimen is shown in Figure 128. One full-scale crash test was performed to NCHRP Report 350 TL-3 criteria, though the test article was deemed inadequate due to vehicle rollover.
Schmidt et al. (2009) designed a precast, vertical-faced bridge rail system for attachment to a composite bridge panel deck. The composite deck was identical to the deck used in the design and testing of the New Jersey Safety Shape barrier designed by Stolle et al. (2007). The test specimen is shown in Figure 129. One successful full-scale crash test was performed to MASH TL-3 criteria, marking the only successful MASH crash test of a bridge rail on a composite deck to date.
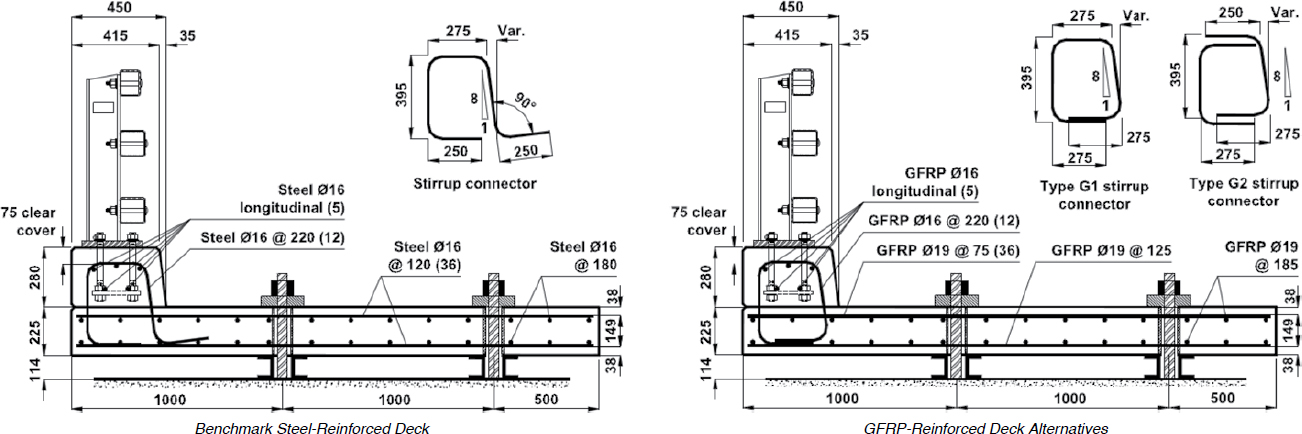

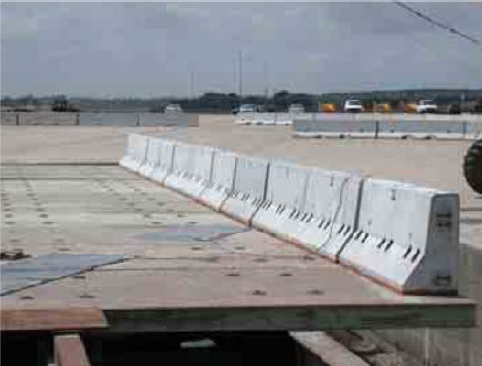

Inverted Tee Concrete Decks
Some bridge decks are formed from the flanges of concrete tee beams used in bridge superstructures, as shown in Figure 130. Polivka et al. (2004) conducted a successful full-scale crash test according to NCHRP Report 350 TL-4 criteria on an open concrete rail secured to an inverted tee bridge deck. No crash tests to MASH criteria on inverted tee bridge decks were identified.
Deck Thickness
The thickness of the deck slab significantly affects the design of the attached bridge rail system. Decks of lower thickness are generally characterized by reduced barrier capacity and restricted depth for barrier anchorages.
Existing AASHTO LRFD BDS Philosophy
Current AASHTO LRFD BDS guidance requires minimum thicknesses for deck overhangs supporting bridge rails. For concrete overhangs supporting top-mounted post systems, the minimum thickness is 8 in. If a side-mounted post system is installed, the minimum thickness is 12 in. Deck overhangs supporting solid concrete barriers must be at least 8-in. thick. However, reduced deck thicknesses are permissible if proven adequate in full-scale crash testing.
State of the Art
Multiple decks of thicknesses less than those specified in AASHTO LRFD BDS guidance have been successfully crash tested to MASH criteria. Overall, 5 in. is the minimum deck thickness successfully tested to MASH criteria (Arrington et al. 2011).
Arrington et al. (2011) performed a full-scale crash test to MASH Test 3-11 conditions on the T223 bridge rail anchored to a 5-in.-thick, cast-in-place deck. The test was successful, and neither the barrier nor the deck was damaged significantly. However, the deck slab was anchored to a concrete box beam and did not feature a cantilevered overhang. Details of the deck are shown in Figure 131.
A reduced deck thickness of 6 in. was proven adequate to MASH TL-3 criteria in a full-scale crash test conducted by Williams, Bligh, and Menges (2011). The test featured the TxDOT Type SSTR bridge rail secured to a 6-in., pan-formed deck, as shown in Figure 132. Lateral deck reinforcement was composed of No. 4 bars. Damage to the test article was minimal.
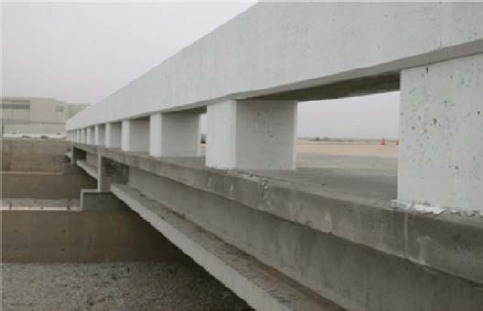


The adequacy of a 6-in. deck thickness was further supported by successful MASH TL-3 testing of the TxDOT Type T222 bridge rail performed by Williams, Bligh, and Menges (2014). The deck test article, shown in Figure 133, experienced minimal damage in the test.
Additionally, a successful crash test to MASH TL 4-12 conditions was performed on a single-slope barrier secured to a 7-in. deck by Williams, Sheikh, et al. (2018). The test article is shown in Figure 134. No damage to the deck was reported.
Accounting for Deck Flexibility
Most design and evaluation practices assume the deck acts as a rigid structure. However, any deck supporting a rail subjected to impact loads will experience some deflection, albeit negligible

in many cases. To address the effect of deck flexibility on the capacity of concrete bridge rails, Badiee (2014) incorporated structural flexibility into a proposed bridge rail design procedure. In the proposed method, the deflection of the deck is superimposed with the deflection of the barrier to describe an overall deflection, as demonstrated in Figure 135. In the yield-line evaluation of the barrier, the internal work done over the barrier yield lines is equated to the work done by the external load minus the work associated with the deflection of the deck. Additionally, the total lateral deflection accounting for barrier and deck flexibility was used to determine the overall external work done on the system.
In the method proposed by Badiee (2014), the moment of inertia of a unit-length deck section is first calculated. Then, the deflection angle of the deck overhang was calculated as
| (78) |
where H is the height of the barrier, tdeck is the deck overhang thickness, and Loverhang is the overhang length; Ec is the modulus of elasticity of concrete; I is the moment of inertia; Ideck is the moment of inertia of the deck; M is the moment induced by the transverse load, Ft, about the deck edge; L is the span length. The lateral deflection of the barrier due to this rotation was determined as
| (79) |
Similarly, the deflection of the barrier, excluding deck effects, was determined by idealizing the barrier as a cantilever
| (80) |
where a is the height on the barrier at which force is applied, analogous to He in the yield-line method. The total lateral deflection of the barrier is then determined via superposition.
| (81) |
The deflection of the barrier due to deck rotation is accompanied by strain energy absorption in the deck, which is not accounted for in the traditional yield-line method. The strain energy absorbed by the barrier and deck is
| (82) |
where F is a general force and Δ is a general displacement.
In the traditional yield-line method for concrete parapet barriers, the external work is set equal to the work done across the forming yield lines. In the alternative method proposed by Badiee 2014, the strain energy due to cantilever bending is included, resulting in
| (83) |
where W refers to work.
Accounting for the strain energy due to cantilever bending effectively increases the capacity of the barrier by virtue of reducing the overall external work to which it is subjected. This relationship is used to determine a critical length, Lc, which is then used in the traditional yield-line equations. Substituting known terms into this relationship yields
| (84) |
where β is:
| (85) |
and b is the height of the vehicle c.g. When solved for Ft, this becomes
| (86) |
To determine the critical length of the yield-line mechanism, Lc, equation 86 is minimized with respect to Ft to yield.
| (87) |
This critical length is then used to determine Ft and, subsequently, the maximum allowable lateral force that can be resisted by the barrier. Resistances calculated using this method will be greater than those calculated using the method presented in AASHTO LRFD BDS Section 13.
In a similar philosophy, Matta and Nanni (2009) incorporated deck flexibility into the calculation of lateral stiffness for the posts of a GFRP-reinforced open concrete rail. The overall deflection response of the post was determined as the sum of the post’s lateral bending
contribution and the deck overhang’s vertical bending contribution. These contributions are demonstrated in Figure 136.
The total lateral displacement of the top of the rail, up, was estimated as
| (88) |
where u is the total displacement, H is the height of the post, θd is the rotation angle at the end of the overhang, and up is the lateral displacement of the post neglecting deck rotation. The system is subjected to a distributed moment, Md/Lp, and a distributed force, Fp/Lp. The deck rotation angle was determined as:
| (89) |
where Fp is the lateral force on the post, Id is the moment inertia of the deck, Lp is the participating length of deck (length of post, in this case), and loverhang is the length of the overhang. The lateral displacement of the post neglecting deck rotation was determined as:
| (90) |
in which Ip is the moment of inertia of the post. Post forces were estimated using these relationships as a function of displacement and plotted against the open concrete rail system’s measured response in a static load test. This comparison, which indicates the accuracy of the analytical model, is shown in Figure 137.
Barrier Anchorages
Bridge rails must be secured to bridge deck systems with suitable anchorage to maintain a predictable and reliable load path. Types of anchorage systems vary with the bridge rail characteristics. Cast-in-place concrete barriers, precast concrete barriers, and metal post-and-beam systems all require different deck anchorages. Additionally, metal post-and-beam rails installed on the top of concrete parapets require anchorage systems.
When installed during initial construction, anchorage systems are usually integrated into the concrete deck or barrier in some way. Decks can be constructed with anchorage plates and protruding bars onto which the concrete barrier can be cast. Conversely, precast barriers can be constructed with an attached anchor plate that is bolted through bored holes in the deck.


When installed after the initial construction, anchorage systems involve bored, epoxied holes into which anchor rods are sunk and secured. These retrofit systems are necessary when a new bridge rail is installed on an existing deck or when a new metal rail is installed on top of an existing parapet.
Design philosophies and construction procedures vary significantly based on the anchorage type. Identified anchorage types, including retrofit epoxy anchorages, are discussed herein.
Existing AASHTO LRFD BDS Philosophy
Current AASHTO LRFD BDS guidance provides little information on barrier-to-deck anchorages. It is required that the yield strength of anchor bolts for steel rails is able to be developed. Similarly, it is required that the reinforcement of concrete barriers is embedded with a depth sufficient to develop its yield strength. Additionally, some guidance is provided regarding bonding agents.
State of the Art
The manners in which bridge rail systems are anchored to the superstructure vary significantly with the type of bridge rail. Cast-in-place concrete barriers are anchored to the deck with steel rebar and require sufficient embedment length to develop the barrier strength. Alternatively, precast concrete barriers are typically secured to the deck with anchor rods extending through the barrier and into the deck or with anchored baseplates. Metal post-and-beam systems are secured to the deck with bolted baseplates fastened to the deck surface or the exterior face of the deck slab. Significant research has been performed regarding barrier anchorages and provides anchorage analysis and design in greater detail than the current AASHTO LRFD BDS guidance.
Cast-in-Place Concrete Barrier Anchorages
As cast-in-place concrete barriers are either cast monolithically with the bridge deck overhang or in a second pour onto the formed deck, these systems are able to be anchored to the
superstructure by virtue of steel reinforcement spanning the deck-to-barrier joint. As such, the sufficiency of the anchorage of a cast-in-place concrete bridge rail is related to the steel reinforcement configuration and bar embedment lengths.
Current AASHTO LRFD BDS guidance requires a hook development length of 6 in. or eight bar diameters to fully develop the strength of reinforcing steel. However, for bridge decks of reduced thickness, satisfying this requirement becomes tenuous. While anchorages to decks cast onto prestressed box beams could meet AASHTO LRFD BDS requirements by penetrating into the box, doing so is considered problematic. Anchoring a barrier system into a concrete box beam requires careful detailing to maintain proper embedment lengths and can cause costly damage to the superstructure. In response to this design hurdle, Arrington et al. (2011) conducted an effort to design a system to anchor the TxDOT T223 rail to a 5-in. deck cast onto a precast box beam. The goal of the effort was to design a MASH-compliant system that did not require penetration into the box beam for sufficient anchorage. The final design differed from the TxDOT standard design in (1) deeper extension of the primary U-bar into the deck, (2) addition of a longitudinal deck bar to better tie the anchor into steel protruding from the box beam, and (3) addition of supplementary longitudinal bars in the barrier to distribute the impact load over a greater number of anchors. The final design is shown in Figure 138. While the design is not admissible according to AASHTO LRFD BDS development stipulations, it was successfully crash tested to MASH TL-3 criteria.
An unconventional anchorage design was used in statically tested open concrete rail specimens designed by Matta and Nanni (2009). The design, shown in Figure 139, anchors an FRP-reinforced open concrete rail to a 7-in. deck overhang with cast-on and reinforced by stay-in-place panels with an integrated double-layer grating fabricated from GFRP pultruded I-bars and cross rods. The design additionally incorporates a shear key into the deck slab. The shear key, which adds a


bearing surface to aid in the shear transfer from the post to the deck, effectively reduces the shear developed in the vertical anchor bars.
Matta and Nanni also proposed a post-to-deck design methodology assuming that the strength of the connection is controlled by diagonal tension failure at the free corner of the deck overhang (Figure 140). This failure mechanism is observed frequently, including in several load tests performed by Arnold and Hirsch (1985). The procedure, demonstrated in Figure 141, yields a maximum allowable lateral force that can be exerted on an individual post. In this particular application, Matta and Nanni were emulating the Kansas corral rail, so a lateral post resistance equal to that system, 44.5 kN, was desired. In a general application, this value would be replaced with the lateral impact force divided by the number of posts participating in resisting the impact.
In this mechanism, the transverse post load, Fp, produces a vertical compression force, Cp, at the back face of the post. This vertical compression is transferred to the deck overhang by forming a diagonal compression strut spanning from the apex of the top anchor bar’s bend to the apex of the bottom anchor bar’s bend. The length of the strut, ldc, is determined accordingly. The transverse load, Fp, is transferred to the deck as an axial force and a bending moment, Md, which forms a force couple, Cd and Ff,d. Additional parameters involved in the methodology include the post width, Lp, the lateral impact force, ft, and the height of the impact force, He.
Precast Concrete Barrier Anchorages
Whereas cast-in-place barriers can be secured to the superstructure with reinforcement protruding from the deck, precast concrete barriers must be externally fastened to the deck

with an anchorage system. Precast concrete barriers can be fastened to the superstructure with anchor rods passing through the barrier and into the deck or with anchor plates bolted to the deck surface.
Bleitgen and Stiemer (2006) amassed a review of bolt-down anchorages for precast barriers used in the United States and Canada. The BC MoT currently uses three variations of a bolt-down anchorage for precast concrete bridge barriers of varying heights. The anchorage, shown in Figure 142, consists of an HSS 60 × 4.8 bolt sleeve that extends vertically from a blockout in the barrier toe to the bottom of the barrier. The sleeve is secured to a WT-shape extending laterally into the barrier to prevent sleeve breakout under extreme loading conditions. Each barrier height (810 mm, 865 mm, 875 mm) utilizes similar anchorage designs with variations limited to the sizing of the bolt, sleeve, and anchoring WT shape.
The Ministry of Transportation Ontario (MTO) employs an anchorage design similar to that used by BC MoT; both feature a sleeve and blockout at the toe of the barrier. However, whereas the BC MoT design uses a WT shape to fix the anchorage to the barrier, the MTO design secures the anchorage to the barrier with bent rebar, as shown in Figure 143. Two types of this anchorage design are used that vary slightly in the arrangement of the rebar extending into the barrier. The installation of the MTO precast barrier anchorage is performed in four phases: (1) the barrier panels are placed in their appropriate positions; (2) holes are drilled through the deck at bolt
sleeve locations; (3) drilled holes are epoxied, and the anchor bars are laid; and (4) nuts are installed and manually tightened to snug fit.
Bleitgen and Stiemer (2006) identified only one anchorage design used in the United States. Similar to the Canadian designs, the anchorage is a blockout and sleeve assembly for precast safety shape bridge barriers. The anchorage is demonstrated in Figure 144.
Additionally, Bleitgen and Stiemer investigated the effect of the deck type on anchorage capacity, suggesting that the capacity of a precast barrier anchor should be estimated as the minimum of tensile and shear limit states. Tensile and shear limit states for precast barrier anchors are demonstrated in Figure 145.
Williams, Bligh, and Menges (2014) successfully crash tested the TxDOT Type T222 precast vertical bridge rail to MASH test 3-11 criteria. The bridge rail, shown in Figure 146, was secured to a 6-in. deck via studded anchor plates. Each 30-ft wall panel was precast onto eight steel anchor plates, each studded with five vertical deformed bar anchors. The wall and anchor plate system was secured to the deck with bolts passing through the anchor plates and into the deck. Additional shear resistance between wall panels was provided with bolted plates spanning expansion joints.
An unconventional anchorage design for portable barriers was evaluated in a 2018 research effort performed by Williams, Sheikh et al. (2018). The anchorage system, shown in Figure 147, consisted of 1-in.-diameter, 17.25-in.-long vertical rods spaced at 72 in. on center. The anchor rods were installed in drilled holes with Hilti RE 500 epoxy injections and extended into a recess that spanned the length of the barrier. The barrier and anchorage system was successfully tested to MASH TL-4 criteria.
Metal Post-and-Beam Anchorages
Metal post-and-beam systems with anchorages deemed MASH-compliant via full-scale crash testing are collected in Tables 14 and 15. Anchorage systems for post-and-beam systems vary significantly based on the mounting locations and rigidity of the bridge rail.


Top-mounted systems are secured to the deck surface with a bolted anchor plate. The manner in which the anchor plate is bolted to the deck varies with the deck conditions. Curb-mounted systems, for example, are typically anchored to vertically protruding bolts secured to an anchor plate embedded in the pour of the superstructure. This type of anchorage, demonstrated in Figure 148, is utilized in the TL-3 TxDOT T1F rail (Williams, Bligh, Buth, et al. 2007), TL-3 TxDOT T1P rail (Williams, Bligh, and Menges 2012), TL-3 TxDOT T1W rail (Bligh, Menges, Griffith, et al. 2019), TL-4 TxDOT C2P rail (Williams, Bligh, et al. 2017), TL-4 Alaska 2-Tube Bridge Rail (Williams, Menges, and Griffith 2019), and TL-5 PennDOT (Pennsylvania DOT) PA Bridge Barrier (Bullard et al. 2018).
It is common for vertical bolt anchorages to be fastened at their embedded end with a hex nut to better anchor the system to the parapet. For example, the TL-3 Glenwood Canyon bridge rail is anchored to the deck with short bolts capped with a ⅞-in. heavy hex nut secured to each bolt for better anchorage to the parapet (Bligh, Menges, and Schroeder 2019). Additionally, the TL-4 William P. Lane bridge rail (Figure 149) is secured to a safety shape parapet with long anchor rods capped with ⅝-in. heavy hex nuts (Williams, Menges, and Kuhn 2018). The TL-5 New York State Thruway Authority Three-Rail Bridge Rail anchors with a similarly capped rod system but features a small rectangular plate above each hex nut (Taneja 2018).


Side-mounted bridge rail systems require alternative anchorage designs. For example, the TL-4 Caltrans Type ST-70SM bridge rail anchors to the deck via baseplates bolted to anchor rods embedded in the pour of the superstructure (Her et al. 2017). The system, shown in Figure 150, also features a disc spring situated at the interface between the baseplate and the washer at the end of the anchor rod.
The TL-5 Triborough Bridge and Tunnel Authority (TBTA) bridge rail features a unique baseplate design capable of anchoring into both the supporting bridge span steel and concrete surfaces (Sheikh et al. 2016). In the rail interior, baseplates are bolted to steel plates that are secured to fascia girders, while at the rail ends, the baseplates are secured to concrete foundations with expansion anchors. The TBTA bridge rail anchorage system and baseplate design are demonstrated in Figure 151.
In 2019, Mauricio et al. (2019) conducted a research effort to design a post-to-deck connection system for a MASH TL-4 bridge rail. The primary design goal was a system for anchorage to concrete slabs or precast concrete box-beam girders, which would limit the impact load transferred to the deck and minimize deck damage. Computer simulations in LS-DYNA and dynamic component tests were conducted to refine the anchorage design. The post-to-deck anchorage system developed by Mauricio et al. (2019) (Figure 152) was incorporated into a metal post-and-beam system that was successfully tested to MASH TL-4 criteria by Pena et al. (2019).
Epoxied Retrofit Anchorages
Williams, Buth, and Menges (2007) evaluated existing anchorage systems for the TxDOT T501 and T203 bridge rails and proposed alternative designs for retrofitting damaged anchorage systems. In this project, a standard deck thickness of 8 in. was used. Using existing AASHTO LRFD BDS guidance, the capacity of both systems at interior and exterior locations was first estimated. Then, a 40-ft T501 specimen and a 60-ft T203 specimen were constructed for a suite of static load testing.


Each specimen was tested three times at unique locations: twice at an interior segment and once at an end condition. The T501 rail was anchored to the deck overhang with No. 5 U-shaped bars cast in the deck. The T203 rail was anchored to the deck overhang with No. 4 V-bars, eight of which extended from the deck into each post. Anchorage details for the static load test specimens are shown in Figure 153. A summary of strength estimates per AASHTO LRFD BDS and strengths determined in the static load testing sequence is shown in Table 22. Results of the static load testing indicated that AASHTO LRFD BDS practices provide reasonable estimates for anchorage strength and that the T501 and T203 anchorage systems were insufficient for MASH TL-3 impact conditions at free ends.


After the suite of static load tests, both rail specimens were reconstructed and subjected to dynamic bogie testing. Each specimen was tested three times: two tests performed at interior spans and one test performed at a free end. Anchorage strengths determined in the dynamic load test sequence, shown in Table 22, were consistent with static strength estimates.
Informed by the results of the static and dynamic testing suites, Williams, Buth, and Menges (2007) designed an alternative anchorage system for the T501 rail that could be implemented as a retrofit for damaged or aging systems. In the preceding tests, the primary U-bar anchors in the T501 rail were outfitted with strain gages with which average developed tensile forces were measured. These measured forces were used in the design of the retrofit/repair anchorage system. The final design, which addressed strength, temperature, and long-term effects, used the propriety, injectable epoxy Hilti RE 500 Adhesive Anchoring System (Hilti 2023) and featured No. 6 bent dowel bars spaced at 16 in. on center. The dowel bar design was selected for two reasons: (1) this anchor type is easily fabricated, and (2) the bent bar design maximized the eccentricity from the outer edge of the barrier to the anchor centerline, resulting in increased flexural capacity. The spacing of the anchoring dowel bars was reduced to 8 in. near joints and free ends. The retrofit/repair anchorage system for the T501 rail is shown in Figure 154. To install the retrofit design, the conventional anchorages used in the preceding tests were removed, bent dowels were secured to the deck using RE 500 epoxy injections, and a new T501 rail was cast onto the retrofit dowels.
Three dynamic bogie tests were performed on the T501 barrier with the retrofit anchorage design. The anchorage systems performed adequately in the three tests, as shown in Figure 155, with the strength of the barrier being fully developed in each test.
Additionally, a retrofit anchorage design for the T203 open rail was proposed. Using anchorage tensile loads measured from strain gages in the preceding testing suite, an alternative was designed consisting of unbent vertical No. 5 bars spaced at 8 in. on center. The retrofit T203 rail anchorage considered temperature and long-term effects and used RE 500 epoxy injections. In the retrofit design, the vertical anchor bars were situated at a greater spacing to maximize the pullout strength of the RE 500 epoxy. Uniform anchor spacing was used throughout. The retrofit/repair anchorage system for the T203 open rail is shown in Figure 156. The installation procedure for the T203 retrofit system was the same as that of the T501 retrofit system.
Three dynamic bogie tests were performed on the T203 barrier with the retrofit anchorage design. The anchorage systems performed adequately in the three tests, as shown in Figure 157, with the strength of the barrier being fully developed in each test. A summary of the retrofit system strength for each barrier is shown in Table 23. Retrofit anchorage strengths for both the T501 and T203 rails were close to those of conventional anchorage designs and were sufficient to allow barrier failure mechanisms to occur.
Table 22. Evaluation of conventional cast-in-place anchorages (Williams, Buth, and Menges 2007).
| Barrier Type and Load Condition | AASHTO LRFD Capacity Estimate (kips) | Experimental Static Strength (kips) | Experimental Dynamic Strengtha (kips) |
|---|---|---|---|
| T501 Midspan Location A | 59.7 | 66.0 | 66.0 |
| T501 Midspan Location B | 59.7 | 75.0 | 70.0 |
| T501 Joint Location C | 36.4 | 41.0b | 46.0 |
| T203 Midspan Location E | 71.0 | 73.5 | 72.0 |
| T203 Midspan Location F | 71.0 | 72.0 | 70.0 |
| T203 Joint Location D | 23.2 | 33.0b | NA |
a50-ms average.
bLess than AASHTO LRFD BDS minimum required capacity of 54 kips for TL-3.

Some anchorage designs feature bolts that penetrate vertically into the concrete without an embedded anchor plate. This type of anchorage, shown in Figure 158, is common in parapet-mounted metal systems and is used in the TL-4 TxDOT C402 rail (Bligh, Menges, et al. 2019).
Additionally, this anchorage design is well-suited for retrofit applications as it can be installed into existing concrete. The TL-4 retrofit AIMS Liferail, shown in Figure 159, employs vertical anchor rods inserted into drilled holes filled with Hilti RE 500 epoxy (Lawler 2019). Similarly, both the 39-in. and 46-in. variants of the Lake Pontchartrain TL-4 retrofit bridge rail feature a vertical anchorage system secured to a parapet with Hilti epoxy (Williams, Menges, and Kuhn 2015; Williams, Bligh, et al. 2016).
A retrofit anchorage design for the curb-mounted TxDOT T131RC rail secures with epoxy-anchored bars as well but in a unique design demonstrated in research by Williams, Bligh, and Menges (2012). The rail system is welded to angled plates secured to the existing curb via anchor bars inserted into Hilti RE 500 epoxied holes drilled in the front and top faces of the curb. The TxDOT T131RC rail (Figure 160) is compliant with MASH TL-3 criteria.
Dickey et al. (2012) developed a procedure for implementing epoxy adhesive anchorage systems for concrete bridge railings. To investigate the behavior of epoxy anchors under dynamic loads, 16 bogie tests and one static test were performed. The testing suite included tensile and shear tests of isolated and grouped anchor rods with and without epoxy coating. Failure modes included steel fracture, adhesive bond failure, and concrete breakout. Typical failure modes observed in the series are shown in Figure 161.
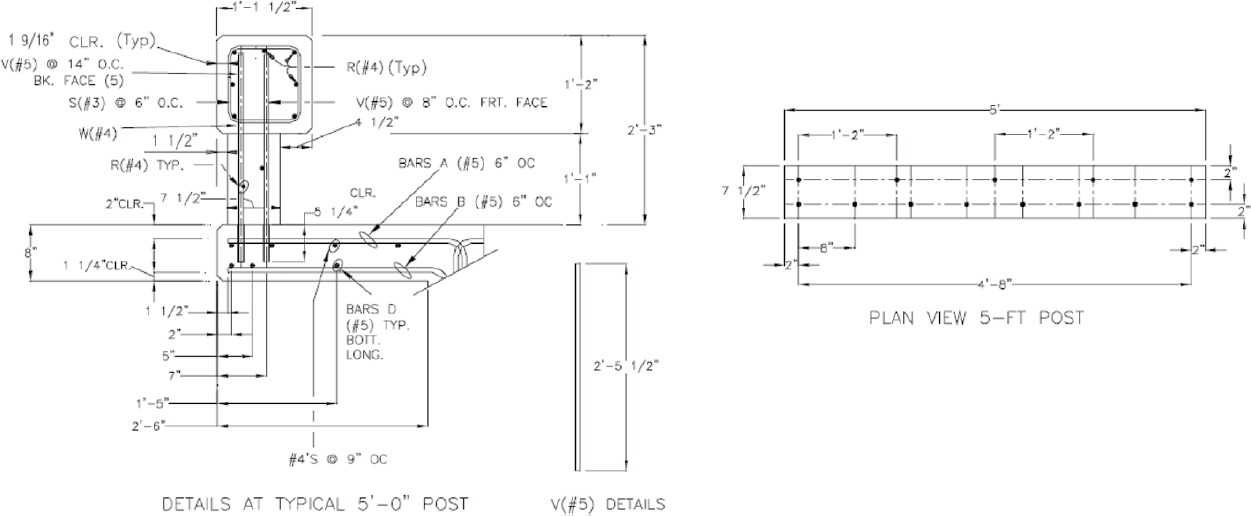

Table 23. Dynamic failure load (50-ms average) of retrofit anchorages for cast-in-place barriers (Williams, Buth, and Menges 2007).
| Barrier Type and Load Condition | Conventional Anchorage (kips) | Retrofit Anchorage (kips) |
|---|---|---|
| T501 Midspan Location A | 66.0 | 64.5 |
| T501 Midspan Location B | 70.0 | 61.0 |
| T501 Joint Location C | 46.0 | 50.0a |
| T203 Midspan Location E | 72.0 | 67.0 |
| T203 Midspan Location F | 70.0 | 69.5 |
| T203 Joint Location D | NA | 39.5 |
aObtained from static load test.


A static load test was also performed on an epoxied anchor rod to investigate failure mechanism and ultimate strength. The failure mode observed in this test was a hybrid failure of concrete breakout and adhesive bond failure, as shown in Figure 162.
Informed by the results of this testing series and an extensive literature review, Dickey et al. (2012) determined that the anchorage design procedure outlined in ACI 318-11 significantly underestimates anchorage strength. A comparison of the as-tested strength to the strength predicted by the cone or uniform bond method and the ACI 318-11 method is shown in Table 24. On average, actual, as-tested anchorage strengths were 1.54 times higher than those predicted by the cone method and 1.93 times higher than those predicted by ACI 318-11.
Dickey et al. (2012) suspected that the increases in strength were the result of dynamic loading effects, as ACI 318 provisions for anchorage strength assume static loading. To better predict the anchorage strength, dynamic increase factors (DIFs) were applied to the steel strength, concrete strength, and epoxy bond strength. The DIF applied to the steel strength was 1.18, as determined in the dynamic testing sequence; the DIF applied to the concrete strength was 1.88, as determined in a comparison of the as-tested breakout strength to the cone method breakout strength. Dickey et al. list several DIF estimates for epoxy adhesive bond strength: (1) 1.40, as recommended by Hilti (Hilti 2023); (2) 1.60–2.40, as recommended by Berra and Solomos (2005); (3) 1.25, as permitted by ACI 349-97 (ACI 1997); and (4) 1.20, as suggested by Braimah et al. (2009). Ultimately, Dickey et al. used the DIF of 1.40 recommended by Hilti. Hilti also


Table 24. Comparison of as-tested and expected anchorage strengths (Dickey et al. 2012).
| Test Article | Failure Mode | Actual As-Tested Strength (kips) | Cone Method Strength (kips) | ACI 318-11 Strength (kips) |
|---|---|---|---|---|
| #5 Bar Uncoated | Steel fracture | 38.4 | 26.5 | 22.1 |
| #5 Bar Uncoated | Steel fracture | 39.4 | 26.5 | 22.1 |
| #5 Bar ECR | Steel fracture | 36.0 | 26.5 | 22.1 |
| Two #5 Bars, Spaced at 8 in., ECR | Steel fracture, bond failure | 73.8 | 38.6 | 32.2 |
| Two #5 Bars, Spaced at 8 in., ECR | Concrete breakout, bond failure | 72.5 | 38.6 | 32.2 |
| #6 Bar ECR | Bond failure | 41.3 | 29.8 | 23.2 |
| #6 Bar ECR | Bond failure | 43.7 | 29.8 | 23.2 |
| Two #6 Bars, Spaced at 8 in., ECR | Concrete breakout, bond failure | 60.7 | 41.4 | 34.8 |
| Two #6 Bars, Spaced at 8 in., ECR | Concrete breakout, bond failure | 75.6 | 41.4 | 34.8 |
| 1⅛-in. A307 Threaded Rod | Concrete breakout, bond failure | 45.3 | 39.3 | 23.2 |
| #6 Bar Uncoated | Bond failure | 47.2 | 29.8 | 23.2 |
| Avg. Ratio of Actual-to-Expected Strength: | — | 1.54 | 1.93 | |
NOTE: ECR: Epoxy-coated reinforcing steel.
recommends an increase factor of 0.06 for concrete strengths above 4,500 psi, so this increase factor was also applied. Dickey et al. also applied a 10% reduction factor to the bond strength for a less aggressive bond strength estimate. After increasing expected capacities using DIFs, the average ratio of actual to expected strength was 1.14 for the cone method and 1.33 for the ACI 318-11 method. These ratios indicated a more accurate, yet still conservative, estimation of the actual strength of the anchorages.
Dickey et al. incorporated these findings into a new design methodology for bridge anchorages using epoxy adhesive anchors installed post-construction. Overall, the methodology begins with establishing basic parameters and iterating between the barrier and anchorage design to satisfy yield-line theory (per AASHTO LRFD BDS Section 13), ACI 318-11 provisions, and design requirements. The procedure is as follows:
- Establish barrier containment level and design load.
- Establish barrier shape and geometry.
- General – height and width.
- Offset.
- Anchor edge distance.
- Establish anchorage variables.
- Anchor size and strength.
- Anchor spacing.
- Establish epoxy and concrete variables.
- Epoxy bond strength.
- Concrete strength.
- Embedment depth.
- Deck thickness.
- Predict tension anchor failure strength utilizing ACI 318-11.
- If steel fracture is expected to control strength, go to step 6.
- If concrete breakout or epoxy failure is expected to control strength, return to step 3 or 4 and modify as necessary.
- Calculate lateral barrier resistance per AASHTO LRFD BDS Section 13 yield-line methodology.
- If φRw ≥ Ft, proceed to step 7.
- If φRw < Ft, strengthen barrier Mw.
- If φRw < Ft and Mw cannot be increased, strengthen barrier Mc and reconfigure anchors to comply with new Mc.
- Calculate total number of anchors within yield-line critical length.
- Calculate anchorage system shear capacity.
- Shear capacity is the sum of the factored capacity of all anchors within the critical length.
- If the shear capacity is less than the design load, the anchors must be strengthened.
Bielenberg et al. (2015) applied the methodology proposed by Dickey et al. (2012) to metal rails anchored to concrete parapets. The concepts were designed using a modified version of the ACI 318-11 procedures for embedded anchor design. DIFs were applied to various limit states, including concrete breakout, steel fracture, and bond strength. The same DIFs were applied as those proposed by Dickey et al.: 1.18 for the steel strength, 1.88 for concrete strength, and 1.484 for the epoxy bond strength. Anchorage capacities were reduced to account for the influence of adjacent anchors and the distance to the edge of the concrete. Anchorages exert force on an area of influence. If this area intersected with other anchorages’ areas of influence or extended past the concrete edge, the capacity of the anchor was reduced by the ratio of the exclusion area to the original assumed influence area. Additionally, a hybrid breakout-bond failure mechanism was assumed in which the upper half of the anchor embedment contributed to a concrete breakout, and the lower half of the anchor embedment contributed to a bond failure. This hybrid mechanism, which was assumed to be more realistic for reinforced slabs or parapets, is shown in Figure 163.

Barrier Geometry Considerations
Various geometric characteristics of bridge rails, independent of the strength or height of the system, can have a significant effect on impact behavior. Parameters to consider include snag potential related to rail geometry, risk of impact between the vehicle occupant’s head and the rail, objects placed on or behind the rail, aesthetic asperities or surface treatments, and barrier discontinuities such as expansion joints. Although the strength and height of bridge rails are of great importance for preventing catastrophic failures, these more subtle design aspects can greatly impact a system’s overall level of safety in the event of a collision.
Post Spacing and Setback
Post-and-beam bridge rails, if not proportioned correctly, can pose a significant snagging hazard to errant vehicles. Post setback, vertical rail spacing, and the ratio of rail face height to the total height of the system should all be considered in the design of post-and-beam bridge rails.
Existing AASHTO LRFD BDS Philosophy
Current AASHTO LRFD BDS guidance provides design charts that demonstrate acceptable combinations of post setback, vertical clear openings, and contact ratios. The diagrams, which were empirically derived from crash tests performed to NCHRP Report 230 criteria, are shown in Figure 164. The manner in which post setback is measured depends on the post section geometry, reflecting the variable propensity for wheel snag posed by different shapes. For example, setback for circular posts is measured to the post centerline, while setback for rectangular posts is measured to the traffic face of the post. In addition to requiring adherence to the geometric design charts in Figure 164, current guidance requires that the total height of rails in contact with the vehicle is at least 25% of the overall height of the barrier. Clear openings are required to abide by the guidance provided for pedestrian and bicycle railings.
State of the Art
The design charts provided in the current AASHTO LRFD BDS guidance were derived using data from crash tests performed to NCHRP Report 230 (Michie 1981) criteria. However,

the conversion to MASH criteria imposed significant and near-universal increases to impact severities, indicating a potential for more severe snagging hazards. Silvestri-Dobrovolny et al. (2017) suggested that, while the relationships of current design guides should be reevaluated with MASH crash-test data, an insufficient quantity of tests have been conducted to warrant such an investigation. Though dated, geometric requirements of current AASHTO LRFD BDS guidance continue to be used in practice. Silvestri-Dobrovolny et al. (2017) incorporated existing geometric requirements in a MASH-equivalency study determining which NCHRP Report 350-approved systems would require testing to be deemed adequate.
In a research effort to design a TL-4 metal post-and-beam bridge rail, Pena et al. (2019) considered additional geometric conditions outside of current AASHTO LRFD BDS guidance. Per MASH evaluation criteria, any test in which vehicle windows shatter due to rail contact is deemed unsuccessful. As such, informed by a review of MASH test vehicle window heights, Pena et al. offset the top rail from the lower rails by 1 in., as shown in Figure 165.
Additionally, Pena et al. proportioned rail heights considering typical vehicle bumper heights to further reduce the potential for direct post impact. Configurations of the rigid, structural components of MASH test vehicles were determined as shown in Table 25. By comparing typical bumper heights to the prototype rail design, Pena et al. identified a significant risk of direct post impact for the 1100C test vehicle. This risk is demonstrated in Figure 166 in which the lack of engagement between the 1100C bumper and longitudinal rails is apparent. Pena et al. modified the vertical spacing of longitudinal rails in the final design to address the high potential for snag of the 1100C test vehicle. Full-scale crash testing to MASH TL-4 criteria deemed the post-and-beam system crashworthy, and no significant snagging of the 1100C, 2270P, or 10000S vehicles occurred.
It should be noted that, while the existing AASHTO LRFD BDS geometric considerations (Figure 165) were used to determine MASH equivalency under NCHRP Project 20-07(395) (Silvestri-Dobrovolny et al. 2017), a recently completed research effort analyzed these conditions in further detail. The project, NCHRP Project 22-35 (Williams, Schulz, and Abu-Odeh 2022), will be incorporated into the revision of AASHTO LRFD BDS Section 13 as the results are made available.
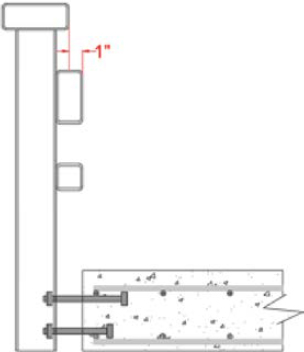
Table 25. Typical front bumper structural component heights (Pena et al. 2019).
| Vehicle Type | Structural Components of Front Bumper | Bumper Height (in.) | |
|---|---|---|---|
| Bottom Edge | Top Edge | ||
| Small Car (1100C) | 48-in. x 3⅞-in. x 2-in. frame | 16¼ | 20⅛ |
| Pickup Truck (2270P) | Two 6-in. square mounting brackets | 18⅜ | 24⅜ |
| Single-Unit Truck (10000S) | 38¼-in. x 10⅜-in. x 4½-in. frame | 23⅛ | 33½ |
Head-Slap Mitigation
Redirection of vehicles impacting safety shape barriers is typically characterized by vehicle roll away from the barrier. Alternatively, vertical and single-slope barriers do not allow significant climb and exert more severe lateral forces onto impacting vehicles. As such, a significant risk of head-slap, or impact between the barrier and the vehicle occupant’s head, arises for vertical and single-slope barriers. Head-slap is associated with high risks of serious injury or fatality.
As part of a research effort to design a TL-5 median barrier, Rosenbaugh et al. (2007) analyzed digital video of NCHRP Report 350 crash tests to develop a head ejection envelope for vertical and single-slope barriers. In total, eight small-car tests and three pickup truck tests were analyzed. SUT and tractor-trailer impacts were not analyzed, as these vehicles are sufficiently tall to mitigate head-slap risks. Lateral and vertical ejection of seat-belted dummies were measured from the lower edge of the window, as shown in Figure 167. By superimposing head ejection envelopes of each test, Rosenbaugh et al. developed exclusion zones for small-car impacts and pickup truck impacts. Additionally, the head ejection envelope was adjusted to account for vehicle roll toward the barrier and interpolated to account for midsize vehicles, such as SUVs and small pickups. The final head ejection envelope is demonstrated in Figure 168.
Zone-of-Intrusion Considerations
When a vehicle impacts a barrier, protrusion of the vehicle over and behind the barrier is likely to occur. This region above and behind the barrier into which the vehicle may penetrate is the zone-of-intrusion (ZOI). If objects, such as signs or mounted luminaire poles, are placed in the ZOI, they pose a potential risk of snagging or occupant compartment penetration. Unless adequate safety performance is validated in full-scale crash testing, the ZOI should be free of fixed objects.
In 2003, researchers at MwRSF performed a comprehensive review of full-scale crash tests of bridge rails and median barriers to define the ZOI for traffic barriers (Keller et al. 2003). The primary goal of the investigation was to determine the extent to which pickups and SUTs intrude over the top of barriers during impact. To estimate the intrusion of vehicles over the barrier systems, high-speed film, sequential photographs, and videotapes were analyzed. Intrusion zones related to NCHRP Report 350 TL-2, TL-3, and TL-4 criteria were determined for various barrier types. Intrusion zones determined by Keller et al. (2003) are demonstrated in Figures 169 through 173.


Later that year, researchers at MwRSF investigated typical luminaire configurations to NCHRP Report 350 TL-4 criteria (Wiebelhaus et al. 2008). Three tests were conducted, including (1) test 4-12 with a breakaway luminaire secured to the top of the barrier, (2) test 4-11 with a breakaway luminaire secured to the top of the barrier, and (3) test 4-12 with a breakaway luminaire mounted 10.5 in. behind the barrier. A 32-in. single-slope barrier specimen was used in all tests. In the first test, the SUT impacted the breakaway luminaire and removed it from its base. In the second test, the pickup truck only minorly impacted the luminaire. In the third test in which the pole was mounted behind the barrier, the SUT minorly scraped the luminaire as it rolled over the barrier. The results of each test are demonstrated in Figures 174, 175, and 176. All three tests were deemed successful according to NCHRP Report 350 TL-4 criteria. Wiebelhaus et al. (2008) noted that, for each of the SUT tests, the luminaire was within the ZOI established in the preceding study performed by Keller et al. (2003). As such, the results of this testing suite indicated that objects may be placed inside the ZOI if they are not rigid and that designs violating the ZOI may be permissible if validated by full-scale crash testing.
In 2010, Reid and Sicking (2010) performed computer simulations in LS-DYNA to investigate the intrusion of an NCHRP Report 350 2000P test vehicle when impacting a 40-in. F-shape barrier under TL-2 and TL-3 conditions. The results of the simulation study showed that the vehicle penetrated between 1.8 in. and 2.5 in. for TL-2 criteria and 5 in. for TL-3 criteria. An example of the simulation study is demonstrated in Figure 177.


Research efforts were recently performed by researchers at MwRSF to establish ZOI envelopes for updated MASH impact criteria under NCHRP Project 22-34 (Stolle et al. 2022). The investigation has produced preliminary ZOI envelopes for MASH TL-2 through TL-5 criteria. By analyzing MASH crash-test data, Stolle et al. (2022) developed conservative ZOI envelopes considering all barrier types. These preliminary ZOI envelopes, shown in Figures 178 through 181, are uniformly more extensive than those established by Keller et al. (2003) for NCHRP Report 350 conditions.
Asperities and Surface Treatments
Occasionally, aesthetic treatment of bridge rails is desired. To evaluate the effect of aesthetic asperities and surface treatments on the safety performance of traffic barriers, Bullard et al. (2006) conducted finite element simulations and full-scale crash tests on aesthetic features deemed common in a literature review of domestic and foreign barrier designs. From the investigation, Bullard et al. determined that, for a given asperity width, the permissible asperity depth depends on the angle at which the asperity is carved into the barrier. Acceptable combinations of asperity widths, depths, and angles were defined for safety shape barriers in the design table shown in Figure 182.
A previous research effort investigating the effects of aesthetic asperities and textures was performed by White et al. (2002) at Caltrans. In all, eight crash tests were performed on seven different textured barriers. Detailed results are shown in Table 26. The general conclusions of the study are as follows:
- Single-slope barriers with shallow features, rounded features, and/or beveled leading edges will not typically result in significant snagging.
- Deep textures and patterns near the base of a barrier are likely to cause wheel snagging.
- Textures that feature upward-sloping edges in the direction of travel encourage wheel climb and rollover.
Expansion Joints and Barrier Discontinuities
Expansion joints and barrier discontinuities can have a significant effect on the impact behavior of a bridge rail system. Barrier discontinuities are characterized not only by reduced capacity but by snagging hazards as well. Joint snagging hazards increase with increasing gap width.
Crash-testing data provide insight into the relationship between vehicle snag potential and gap width. Under NCHRP Report 230 criteria (Mitchie 1981), two PL-2 tests were conducted with impacts at a 4.5-in. expansion joint (Holloway et al. 1996). The tests, which included a pickup and SUT impact, were both successful, though vehicle snagging was evident. More recently, researchers at TTI performed a successful MASH TL-4 test with an SUT impacting a 2-in. barrier gap. Additionally, 4-in. barrier gaps have been successfully tested to MASH TL-3 conditions, marking 4 in. as the largest barrier gap successfully tested to MASH criteria. As such, considering crash-test data, researchers at MwRSF recommend that barrier gaps exceeding 2 in. for TL-4 and 4 in. for TL-3 are treated with cover plates or other gap-spanning hardware to reduce the propensity for snagging (Mander et al. 2011).
Alternatively, the barrier asperity guidance provided by Bullard et al. (2006) (Figure 182) can be used to determine acceptable barrier gap widths. If barrier gaps are considered to be vertical asperities, then the acceptable gap width as determined by Bullard et al. is roughly 1 in. As such, vehicle penetration, which can be geometrically estimated based on impact angles, should be limited to 1 in. Based on this estimation method, for a 25° impact angle, gap widths not exceeding 2 in. are permissible (Mander et al. 2011).


In sum, the permissible untreated gap width has not been explicitly investigated, though it can be estimated through crash-test data and theoretical models. If maximum gap widths successfully tested to MASH criteria are considered, untreated widths of 2 in. and 4 in. appear adequate for TL-4 and TL-3 conditions, respectively. Alternatively, if vertical asperity limits are combined with impact geometry, the maximum permissible gap width is 2 in. for any test level.
Roadway Superelevation
NCHRP Research Report 894 from Marzougui et al. (2009) investigates the performance of longitudinal barriers installed on curved, superelevated roadway segments (CSRS). From an extensive simulation study and full-scale crash-testing series, Marzougui et al. proposed the following conclusions:
- Barriers installed on CSRS with superelevations of 8% or greater are prone to vehicle override.
- State DOTs should consider installing taller barriers on the outer edge of CSRS.
- Face slope of concrete barriers on the outer edge of CSRS should be kept at a minimum.
- Underride protection should be considered for post-and-beam barriers installed on CSRS.
- Roadway shoulders should be wide and minimally sloped to avoid increasing the vulnerability to the impacting vehicle.
- Barriers installed perpendicular to the roadway superelevation, rather than plumb, exhibit improved performance.
Sheikh and Alberson (2005) simulated impacts of a 4,581-lb pickup at 62.2 mph and a 25° impact angle with a 32-in.-tall F-shape barrier railing placed plumb to the earth. The barrier was modeled to be rigid, and five superelevations ranging from 0% to 10% were evaluated. In all orientations, the vehicle was successfully redirected, but it was noted at a 10% superelevation the vehicle roll was 40°. A 40° roll angle was deemed marginal. The roll angle with an 8% superelevation was reported to be 39.5°.
Table 26. Results of crash tests performed on textured barriers (White et al. 2002).
| Texture | Demonstration | Depth (in.) | Gap (in.) | θ (degrees) | V (mph) | W (lb) | NCHRP Report 350 Pass/Fail |
|---|---|---|---|---|---|---|---|
| Deep Cobble |  |
2.25–2.50 | Varies | 20.0 | 60.7 | 1,814 | Pass |
| Fluted Rib (45o) |  |
0.75 | 2.00 | 20.0 | 60.1 | 1,767 | Fail (rollover) |
| Deep Cobble | 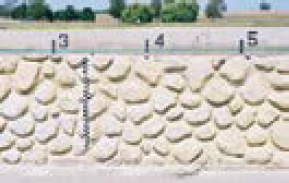 |
2.25–2.50 | Varies | 25.0 | 62.3 | 4,392 | Fail (floorboard deformation) |
| Mission Arch | 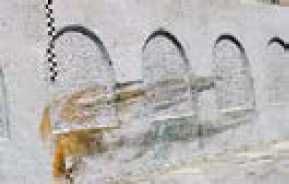 |
1.00 | — | 19.3 | 59.5 | 1,856 | Pass |
| Cobble with Lower Reveal |  |
2.25–2.50 | Varies | 24.3 | 61.6 | 4,317 | Pass |
| Drystack |  |
1.25 | 1.00 | 23.6 | 62.8 | 4,469 | Pass |
| Fractured Granite |  |
0.50 | Varies | 24.0 | 62.3 | 4,332 | Pass |
| Shallow Cobble | 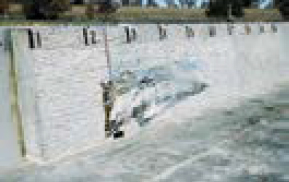 |
0.75 | Varies | 23.6 | 62.6 | 4,312 | Fail (wheel snag) |
Miscellaneous Considerations
Parameters outside of traditional strength evaluation and system proportioning have been described in contemporary research efforts. These factors, which include retrofitting strategies, expected material strengths, and further direction for selecting appropriate test levels, are not addressed in current AASHTO LRFD BDS guidance. However, a better understanding of these miscellaneous parameters could be met with more appropriately designed and efficient bridge rail systems. Additionally, guidance for selecting an appropriate test level has been developed, which is not included in the current AASHTO LRFD BDS.
Retrofitting Strategies
Retrofitting bridge rail systems may be necessary or beneficial for several reasons, including (1) to replace a damaged or aging barrier, (2) to improve the safety performance of an existing barrier, (3) to update an existing barrier to current standards, and (4) to separate pedestrian

walkways from the roadway in the event of increased traffic volume (Ngo et al. 2013). Strategies vary for each scenario, but the Australian traffic agency Austroads proposes a four-stage process for retrofit implementations: (1) determine the ideal test level for site conditions; (2) evaluate the strength of the existing bridge structure; (3) determine if superstructure strengthening is required; and (4) design the barrier retrofit system, which may be a new barrier or a barrier supplement.
Buth et al. (2005) developed two retrofit railing systems for implementation on historic truss bridges. The first truss-mounted design, shown in Figure 183a, featured a steel rail secured to truss verticals with 5-in.-diameter steel tubes. The steel tubes used in the connections were selected for their favorable deformation response during impact (Figure 183b), which reduces the load transferred to truss verticals. The truss-mounted system was deemed adequate for NCHRP Report 350 TL-2 conditions via full-scale crash testing.
The second retrofit rail proposed by Buth et al. (2005) was designed for installation on top of existing curbs. The design, shown in Figure 184, is a steel post-and-beam system that is secured to the existing curb with bolts inserted into epoxied holes drilled into the curb surface.


In a study of historic bridge railings, Frosch et al. (2016) proposed potential retrofit strategies with considerations for site conditions. The first option includes the installation of a modern, inboard railing inside the existing railing, which is left undisturbed, as shown in Figure 185. Inboard railing installations were recommended if adequate clear width is provided and maintaining the aesthetic character of the bridge is desired. If a curbed sidewalk is adjacent to the roadway, Frosch et al. suggested that a retrofit rail should be installed at the existing curb to shield the walkway from errant vehicles. The third and final proposed retrofit option is a complete removal and replacement of the existing system. For this option, Frosch et al. designed modified versions of MASH-compliant bridge railings approximating the appearance of historic rail designs.
Alternative, supplemental retrofit designs are described in the Austroads barrier design guide (Ngo et al. 2013). These retrofit designs feature W-beam rails secured to blockouts that are installed on the existing system, as shown in Figure 186.
As retrofit barrier designs are installed into existing superstructures, their installation typically involves bolted or epoxied anchor rods placed in drilled holes. Consequently, anchorage designs are particularly significant for retrofit systems. A detailed discussion of anchorage designs is found elsewhere in this chapter.

Dynamic Increase Factor (DIF)
Material properties vary with the rate at which they are loaded. When loaded at high strain rates, many materials exhibit higher strengths than when loaded statically. The ratio of dynamic to static strength is often reported as a DIF. DIFs for concrete and steel, which are of particular importance to the impact performance of roadside safety barriers, have been well-documented in several research efforts.
DIFs for concrete loaded in tension and compression are unique. A widely used relationship between strength and strain rate for concrete was first presented in the CEB-FIP Model Code (CEB 1993) in which the compressive DIF is determined as
| (91) |
where
fc = dynamic compressive strength at ,
fcs = static compressive strength at ,
= compressive strain rate, 30 • 10–6 ≤ ≤ 300 s–1,
= static compressive strain rate, 30 • 10–6 s–1,
log γs = 6.156α − 2,
fco = 1,450 psi, and
and
s (in the denominator) = units of time in seconds.
Similarly, the tensile DIF is determined as
| (92) |
where
ft = dynamic tensile stress at ,
fts = static tensile stress at ,
= tensile strain rate, 3 • 10–6 ≤ ≤ 300 s–1,
= static tensile strain rate, 3 • 10–6 s–1,
log β = 7.11δ − 2.33,
fco = 1,450 psi, and
In 1998, Malvar and Crawford (1998) conducted an extensive review of the dynamic strength of concrete in which experimental data were compared to the CEB (1993) formulation. While experimental data agreed with compressive CEB curves, a comparison of data to the tensile CEB
curves showed an apparent discrepancy between tensile DIFs calculated via the CEB formulation and experimental DIF measurements. The comparison of dynamic tensile concrete test data to the original tensile CEB curve is shown in Figure 187. The CEB curve, represented by solid lines, is offset significantly from experimental DIF measurements.
Informed by the comparison to experimental data, a modified CEB curve for estimating tensile DIFs was developed. The alternative tensile DIF expression proposed by Malvar and Crawford (1998) is
| (93) |
where
ft = dynamic tensile stress at ,
fts = static tensile stress at ,
= tensile strain rate, 10–6 ≤ ≤ 160 s–1,
= static tensile strain rate, 10–6 s–1,
log β = 6δ − 2,
fco = 1,450 psi,
and
This modified tensile DIF curve showed far more consistency with experimental data than the original formulation. The comparison of experimental data to the modified tensile CEB curve is demonstrated in Figure 188.


With increasing strain rates, the behavior of steel is characterized by substantial increases to the yield stress, marginal increases to the ultimate strength, and slight decreases to ductility (Davis et al. 2017). Several methods of estimating the dynamic strength of steel have been developed, including empirical, constant DIFs proposed by the U.S. Department of Defense (Dalton et al. 2008) for blast loading and two rate-dependent constitutive models proposed by Johnson and Cook (1983) and Cowper and Symonds (1957). While the foremost is appropriate in strain rate conditions exceeding those expected for traffic impacts, the latter two methods are applicable. The model proposed by Johnson and Cook is
| (94) |
where
A, B, c, n = empirical correlation constants;
= effective plastic strain as a function of time;
= effective strain rate as a function of time;
= reference strain rate; and
σy = yield strength.
Alternatively, the model proposed by Cowper and Symonds is
| (95) |
where
c, p = empirical correlation coefficients (see Table 27) and
= strain rate as a function of time.
Table 27. Empirical Cowper-Symonds coefficients for DIF calculation (Davis et al. 2017).
| Material | c sec-1 | p | Reference |
|---|---|---|---|
| Mild Steel | 40.4 | 5 | Cowper and Symonds (1957) |
| 7.39 | 4.67 | Schneider and Jones (2004) | |
| 114 | 5.56 | Hsu and Jones (2004a) | |
| High-Tensile Steel | 3,200 | 5 | Paik and Chung (1999) |
| Aluminum Alloy | 6,500 | 4 | Bodner and Symonds (1962) |
| 9.39×10¹⁰ | 9.55 | Hsu and Jones (2004b) | |
| α-Titanium (Ti 50A) | 120 | 9 | Symonds and Chon (1974) |
| Stainless Steel 304 | 100 | 10 | Forrestal and Sagartz (1978) |
DIFs for Grade 60 steel reinforcement were explicitly investigated by Malvar (1998). The findings of the study, shown in Figure 189, indicate a breaking point at roughly a strain rate of 2 s–1 beyond which the strength of steel reinforcement increases dramatically.
Further guidance on the dynamic behavior of materials is provided in MASH (AASHTO 2016). MASH guidance notes that a DIF of 1.5 is typically used for steel posts. Additionally, it is noted that no DIF should be used for wood members. No DIF estimate is provided for concrete barriers.
The steel DIF of 1.5 traditionally used in roadside safety hardware applications was investigated by Mauricio et al. (2019) in the design process of a metal post-and-beam anchorage. Based on the results of dynamic bogie testing of anchored steel posts, the overall lateral resistance of the posts was roughly 1.15 times the nominal value. However, this magnification included the effects of both dynamic behavior and material overstrength. Material certifications indicated that the actual yield stress of the steel was roughly 55 ksi—10% higher than the nominal value. Isolating the strength increase owed to dynamic behavior from this material overstrength resulted in a DIF of 1.04.
The bond strength of epoxy adhesive to concrete is also affected by load rate, though these DIF estimates vary widely. Epoxy developer Hilti recommends a DIF of 1.40 for their HIT-RE 500 SD adhesive (Hilti 2023). Berra and Solomos (2005) reported a DIF of anchors installed after the initial construction of 1.60 to 2.40. ACI 349-97 permits a DIF of 1.25 for epoxied anchors (ACI 1997). Last, Braimah et al. (2009) suggested an epoxy anchor DIF of 1.20. The DIF

of 1.40, recommended by Hilti, was implemented in an anchorage study performed by Dickey et al. (2012). After applying this DIF to the adhesive strength alongside steel and concrete DIFs, the accuracy of the estimated anchorage strength improved significantly; the margin of as-tested to expected strength narrowed from 93% to 33%.
Strain Rate of Vehicle Impacts
The accuracy of dynamic strength estimates is heavily dependent on the strain rate used to determine the DIF. However, little research has been performed investigating the strain rate experienced by roadside safety barriers when subjected to vehicle impacts. Based on experimental data, Tedesco et al. (1993) estimated the strain rate of traffic impacts on the order of 10–6 to 10–4 s–1, as shown in Figure 190. Alternatively, Riisgaard et al. (2007) suggest that the strain rate associated with vehicle impacts ranges from 10–4 to 10–3 s–1.
Strain Rate of Steel Reinforcement in Impact
No research has explicitly investigated the strain rate of steel reinforcement in barrier impacts. However, in a study performed by Williams, Buth, and Menges (2007), barriers with strain gages fixed to eight vertical anchor bars were subjected to dynamic testing. In total, six tests were performed from which tensile bar strains were measured as a function of time. An example of the data extracted from one of the dynamic tests is shown in Figure 191 in which a clear peak in strain can be observed 0.04 seconds after impact. Using data from these tests, rough estimates of bar strain rates can be developed using peak bar strains and the time elapsed to reach them. Tensile strain rates in anchor bars as estimated via this method, which is demonstrated with the diagonal line imposed onto the graph of Figure 191, are shown in Table 28. Average strain rates across the eight instrumented bars were calculated for each dynamic test and showed significant agreement between tests.
Static Increase Factors
When structural materials are fabricated, the actual strength of the material is greater than the reported strength of the material. This practice ensures that the vast majority of the fabricated


material is as strong as necessary while maintaining economical manufacturing tolerances. The ratio of a material’s actual strength to its reported strength is addressed with a static increase factor (SIF). SIFs are independent of strain rate. Informed by reviews of steel mill test reports, Dalton et al. (2008) suggest that an SIF of 1.10 is appropriate for the yield stress of Grade 60 reinforcing steel. This suggestion is corroborated in the 2017 Bridge Security Design Manual (Davis et al. 2017). Additionally, based on experimental data, the Bridge Security Design Manual notes an SIF of 1.10 for the compressive strength of 28-day cured concrete. In sum, an SIF of 1.10 is recommended for both Grade 60 steel reinforcement and concrete.
Table 28. Anchor bar strain rate estimates from dynamic testing.
| Test | Maximum Strain Rate (s-1) | Average Strain Rate (s-1) |
|---|---|---|
| 1 | 0.110 | 0.026 |
| 2 | 0.065 | 0.049 |
| 3 | 0.038 | 0.029 |
| 4 | 0.050 | 0.031 |
| 5 | 0.038 | 0.023 |
| 6 | 0.050 | 0.033 |
Application of Seismic Design Principles
When a structure is subjected to seismic loading, member overstrength can result in unfavorable behavior. To ensure energy-dissipating mechanisms occur at desired locations, seismic design principles dictate that overstrength be considered in the design process. As such, the AASHTO Guide Specifications for LRFD Seismic Bridge Design with 2012 and 2014 Interim Revisions contains various overstrength factors for structural members and expected material strengths (AASHTO 2014). Overstrength capacities are determined using a combination of expected material strengths and overstrength factors that are used in conjunction to better describe the full strength of a structural member, rather than the conservative, reduced estimate typically used in traditional design practices. Overstrength factors and expected material strengths specified in the AASHTO LRFD seismic design guide (AASHTO 2014) offer insight into sectional and material behaviors that could be applied to the design and analysis of bridge rail systems.
Expected Material Strengths
AASHTO LRFD seismic design guide (AASHTO 2014) provides material strength estimates that exceed reported values and are expected to be more representative of the actual material strength. For ASTM A 709 Grade 50, A 709 Grade 50W, and A 992 steels, the expected yield stress, Fye, is 1.1 times the nominal yield stress, Fy. For ASTM A 500 Grade B and ASTM A 501 steels, the expected yield stress is 1.4 times the nominal yield stress. Additionally, the expected yield stress for ASTM A 706 and A 615 Grade 60 reinforcing steel bars is 68 ksi, as determined from data collected by Caltrans. The expected compressive strength of unconfined concrete, fce ′ is also specified at 1.3 times the nominal compressive strength, fc′.
Overstrength Factors
Further increases over the nominal strength of a structural member are introduced via overstrength factors applied to the member section capacity. To determine the overstrength capacity of reinforced concrete members, the plastic moment capacity of the member, Mp, is multiplied by an overstrength factor, λmo, of 1.2 or 1.4 as determined in Article 8.5 of the AASHTO LRFD seismic design guide (AASHTO 2014). Similarly, for steel members, the nominal moment strength, Mn, is multiplied by an overstrength factor of 1.2 to determine the overstrength capacity. When determining Mp or Mn, the expected concrete strength and expected steel yield stress discussed in the preceding section are to be used in lieu of nominal values.
Test Level Selection Guidance
Current AASHTO LRFD BDS guidance provides only qualitative aid for the selection of an appropriate barrier test level. Research efforts performed by Ray and Carrigan (2015) and Austroads (Ngo et al. 2013) have resulted in more structured procedures for selecting bridge rail test levels.
In 2014, Ray and Carrigan conducted a research effort to develop guidelines to assist designers in selecting bridge rail test levels based on site characteristics, such as traffic volume, traffic profile, and roadway geometry (Ray and Carrigan 2015). In broad terms, the proposed methodology was a risk-based approach including considerations of estimated crash frequency, crash severity, injury risk, and fatality risk. In the research effort, a roadside safety design software, the Roadside Safety Analysis Program (RSAP), was expanded to perform both cost-benefit analyses and risk analyses. RSAP estimates crash frequency and severity and maps them to dollar amounts based on the corresponding estimated societal cost of each crash. Overall, a bridge rail is deemed cost-efficient by the program if the reduction in societal costs caused by the barrier is greater than the cost of construction and maintenance. Most importantly, Ray and Carrigan sought to
produce structured guidelines for designers as to what constitutes a hazardous condition, such as the exact percentage of trucks to be considered “high volume” or the degree of curvature that marks a “sharp curve.”
Using RSAP, Ray and Carrigan (2015) developed guidelines for selecting the appropriate bridge test level based on site conditions for TL-2 through TL-5 applications. The approach applies to new designs, rehabilitations, and retrofits. The procedure includes six parts: (1) traffic volume (AADT), (2) total encroachments expected over the 30-year life of a 1,000-ft span of bridge, (3) expected number of encroachments adjusted for site-specific conditions, (4) selection of the test level from a design chart, (5) additional considerations, and (6) evaluation of the appropriateness of the preceding guidelines.
First, traffic conditions accounting for growth are estimated. Then, using the tables and figures provided, the expected number of encroachments is estimated. This expected number of encroachments is then modified to account for site conditions, including access point density, lane width, horizontal curve radius, lane quantity, speed limit, and grade. Next, the hazard environment of the bridge is qualitatively evaluated based on the provided guidelines. Characteristics determining the hazard environment include what is beneath the bridge, the risk of fatality, and the extent to which a crash would interrupt traffic flow. At this point, the appropriate test level, shown in Figure 192, is determined using the hazard environment, percent trucks (PT), and the normalized encroachment quantity. The test level suggested in this guidance corresponds to a probability of severe or fatal injury less than 1% over 30 years for a 1,000-ft span of bridge length. It does not account for cost, however, although a more detailed version of the procedure incorporating cost-benefit analysis is presented by Ray and Carrigan (2015) in the same study. As bridge railing costs vary significantly with time and location, the risk-based procedure was recommended by Ray and Carrigan. The more complicated procedure incorporating cost-benefit analysis is left for bridge owners desiring specifically to use this method.

Additionally, Austroads outlines a comprehensive approach to selecting performance levels with qualitative and quantitative considerations for site conditions, average daily traffic counts, and roadway characteristics (Ngo et al. 2013). The selection process consists of three main phases, demonstrated in Figure 193: (1) determine traffic conditions and roadway characteristics, (2) categorize the site, and (3) use category-specific design guides to select the appropriate barrier performance level.
Sites of category CAT1 are characterized by conditions where barriers prevent the passage of debris or would be frequently damaged by debris. The following are characteristics of a bridge categorized as CAT1.
- Height is less than 1.5 m above the ground or water no more than 1.2 m deep.
- Traffic volumes must not exceed 150 vehicles per day.
- Roadway must not feature sharp vertical or horizontal curvature.
- Clear width between curbs must be sufficient.
- Must be no anticipated pedestrian traffic.
If all CAT1 conditions are satisfied, then no barrier is required.
Sites of category CAT3 are those that are subjected to unique or particularly dangerous conditions. These conditions include
- Heightened need to prevent vehicles from leaving the roadway,
- Traffic profile containing special classes of heavy vehicles,
- High-risk environments with traffic volumes exceeding 3,000 vehicles per day, and
- High-risk environments with bus volumes exceeding 150 buses per day.
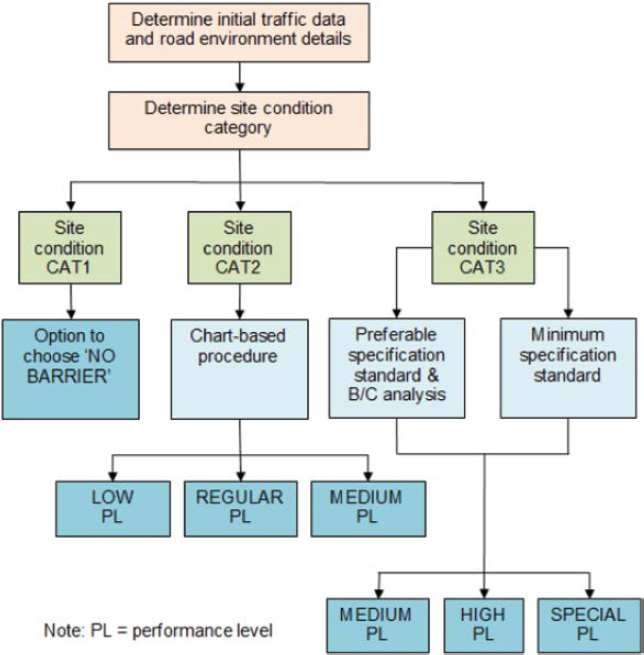

High-risk environments are characterized by bridge heights exceeding 10 m, water depths exceeding 3 m, and horizontal curves less than 600 m. If a site cannot be classified as CAT1 or CAT3, it is considered a CAT2 site.
For CAT2 sites, an adjusted annual average daily traffic (AADT) value is determined by multiplying the nominal AADT by site-specific factors. Adjustment factors address road type, road grade, road curvature, deck height, and under-structure conditions. With the adjusted AADT calculated and the traffic profile described, the appropriate performance level is determined via design charts. Multiple design charts, an example of which is shown in Figure 194, are provided to address different operating speed limits.
Performance levels for CAT3 sites are determined via specification standards or benefit/cost analyses based on traffic profile, site conditions, and roadway characteristics. Australian design specifications must be met for CAT3 sites, but Austroads suggests that benefit/cost analyses be performed in addition to standard compliance. Austroads proposes a benefit/cost analysis procedure, which consists of (1) calculating the frequency of vehicle-barrier impacts, (2) determining the severity of impacts, and (3) comparing costs associated with steps 1 and 2 with the cost of treatment (Ngo et al. 2013).
The methodology proposed in the Austroads barrier design guide is robust and far more comprehensive than current AASHTO LRFD BDS guidance. However, the methodology is not compliant with NCHRP Report 350 or MASH criteria and is instead proposed for conformity with Australian standard AS 5100. As such, the applicability of this methodology to domestic structures is discretionary at best, although the overall philosophy illustrates a clear improvement over the guidance provided in current AASHTO LRFD BDS guidance (AASHTO 2020a).


