CHAPTER 3
Results
The results section is organized into five main sections: Descriptive Analysis of Exposure, Summary Data, Research Objective 1a, Research Objective 1b, and Research Objective 2. The Descriptive Analysis of Exposure section provides descriptive statistics for the critical grouping of teens with more driving exposure versus less driving exposure during the learner’s permit and early independent driving phases.
For Research Objective 1a, the CNC rate was evaluated using a Poisson regression model in relation to driving phase, vehicle access, passenger presence, functional road class, and route familiarity. The KRD event rate was used to better assess TOD, DOW, and route familiarity.
For Research Objective 1b, various risky driving behaviors (e.g., percentage of time speeding, passenger presence) were explored using descriptive statistics, regression models, and/or chi-square statistics to assess differences in driving behavior for teen drivers with more or less driving exposure during the learner’s permit driving phase for the SPDS and during the early independent driving phase for the SHRP 2 NDS.
For Research Objective 2, results were summarized for developing recommendations/strategies.
Descriptive Analysis of Exposure
Table 2 provides an overview of the data used for analyses in the following results sections. Given that the SHRP 2 NDS recruited teen drivers regardless of date of licensure, the total number of SHRP 2 participants with any driving data during the first 6 months of driving dropped the sample size from 254 down to 55 participants. The breakdown of the total number of participants by sex and by driving exposure group is discussed in the following.
Summary Data
Exposure and SCE Event Rates
SPDS
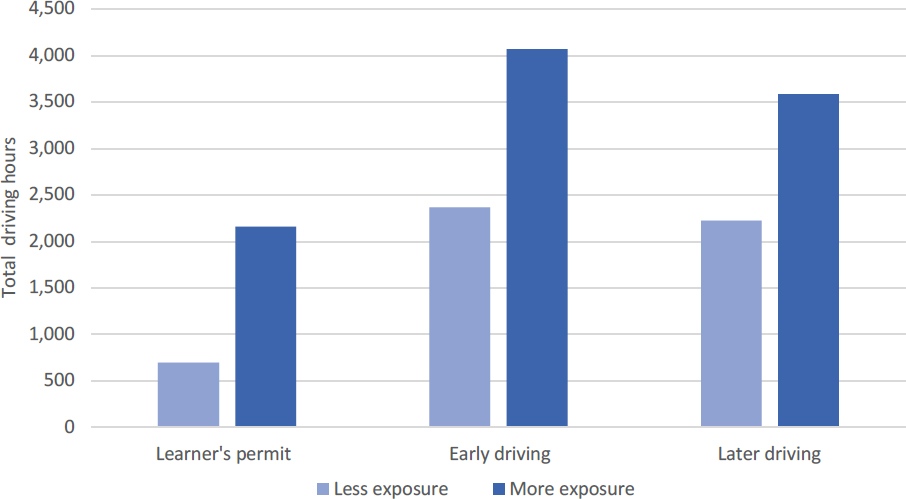
For SPDS participants, the total driving time between the two driving exposure groups was significantly different (t = 6.16, p < 0.01) across all driving phases. This pattern continued into independent driving in that the teen drivers in the more-driving-exposure group continued to drive significantly more hours once they were driving independently during both the early and later independent driving phases (see Figure 5).
Table 2. Overview of data analyzed in Chapter 3.
| Data | SHRP 2 | SPDS | ||
|---|---|---|---|---|
| Teen participants | 55 | 82 | ||
| Sex | Female | 34 | 43 | |
| Male | 21 | 39 | ||
| Driving exposure group | Less driving exposure | Female | 18 | 21 |
| Male | 10 | 20 | ||
| More driving exposure | Female | 16 | 22 | |
| Male | 11 | 19 | ||
| Miles in analysis | 143,061 | 422,629 | ||
| SCEs | 55 | 185 | ||
SHRP 2
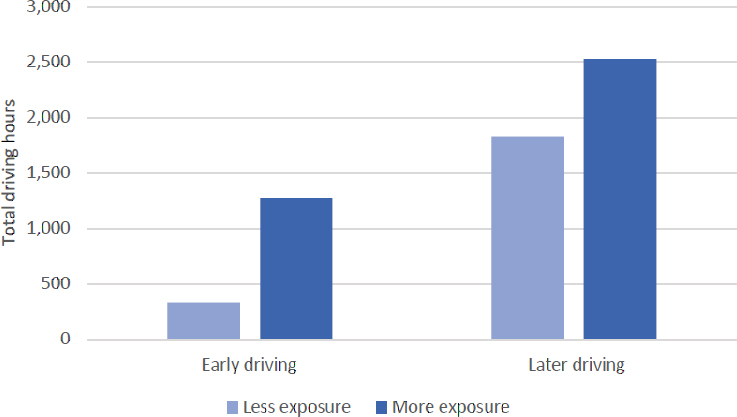
For SHRP 2 participants, the total driving time between the two driving exposure groups was significantly different (t = 6.47, p < 0.01) across two driving phases. This pattern continued into each driving phase in that the more-driving-exposure teen drivers continued to drive significantly more hours (see Figure 6).
Overall SCE Rate in Two Datasets
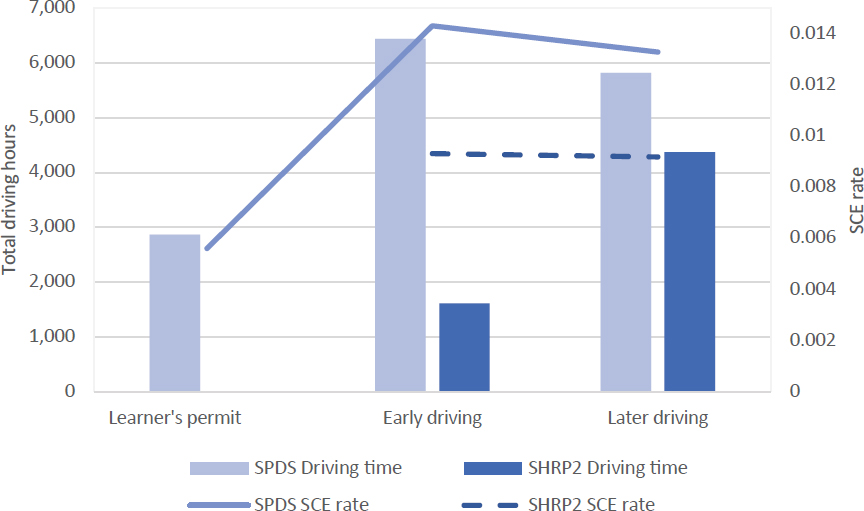
The total driving time and driving miles of 55 teen drivers in the SHRP 2 and 82 drivers in the SPDS are listed in Table A-3 in the appendix. Changes in SCE rate per hour across driving phases were consistent in both datasets (see Figure 7). In the SPDS, the total driving hours and the overall SCE rate in the learner’s permit phase were lower than in other driving phases. During the early independent driving phase, the SCE rate was the highest. This trend across three driving phases is consistent with previous studies. In the SHRP 2 dataset, the overall SCE rate was similar during the early and later independent driving phases.
Comparison of Driving Exposure Groups During the Learner’s Permit Phase (SPDS)
In the SPDS, the number of participants in less-driving-exposure and more-driving-exposure groups was similar. The number of females and males in each exposure group was similar as well (see Table 2). In the more-driving-exposure group, there were three more females than males. In the less-driving-exposure group, the females outnumbered the males by one.
The total traveled hours are 698.23 in the less-driving-exposure group and 2,160.54 in the more-driving-exposure group. For the less-driving-exposure group, this represents an average of 17 hours of practice driving per participant, and for the more-driving-exposure group, an average of 52.7 hours of practice driving per participant. The state of Virginia, where the SPDS was
conducted, requires 45 hours of supervised practice driving during the learner’s permit period; thus, about half of the drivers in this sample received over the minimum required hours. The normalized number of hours of learner’s permit driving over 9 months was 29.6.
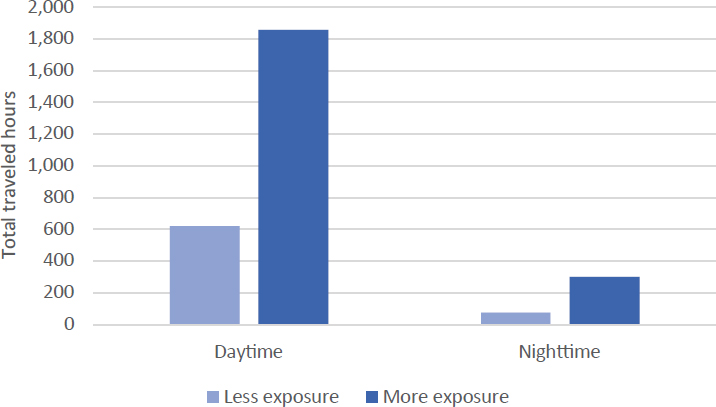
Teenage drivers tended to do most of their practice driving during daylight hours. For both the less-driving- and more-driving-exposure groups, ∼10% of all practice driving occurred during nighttime conditions (see Figure 8). For the less-driving-exposure teen drivers, this translates to an average of 1.9 hours of nighttime practice driving per participant, whereas for the more-driving-exposure group, there was a recorded average of 7.4 hours of nighttime practice driving. Both average values are less than the 10 hours of nighttime driving required for teen drivers in the state of Virginia.
The DOW on which practice driving occurred was split into a dichotomous variable of weekday versus weekend (see Figure 9). For both driving exposure groups, approximately 40% of all
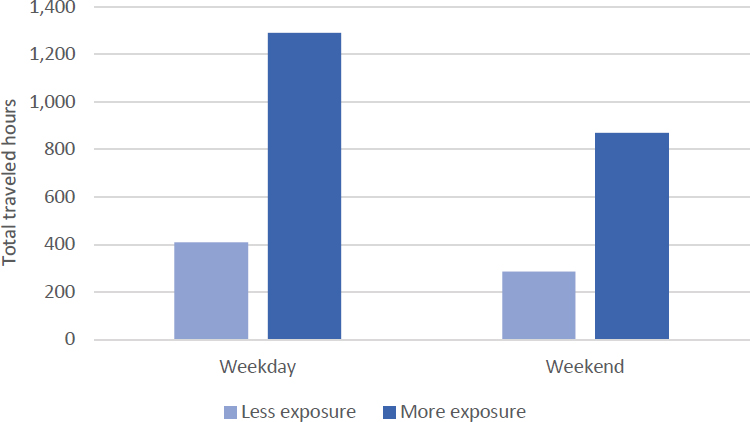
practice driving hours occurred on weekends versus weekdays, which suggests that a significant portion of practice driving happened on weekends. Most likely, weekends are when both parents and teenagers have more time to practice their driving. For each driving exposure group, the overall percentage was calculated by dividing weekend driving hours by total weekend and weekday driving hours. It is important to note that the overall percentage is not different between the exposure groups—rather, the number of hours is different.
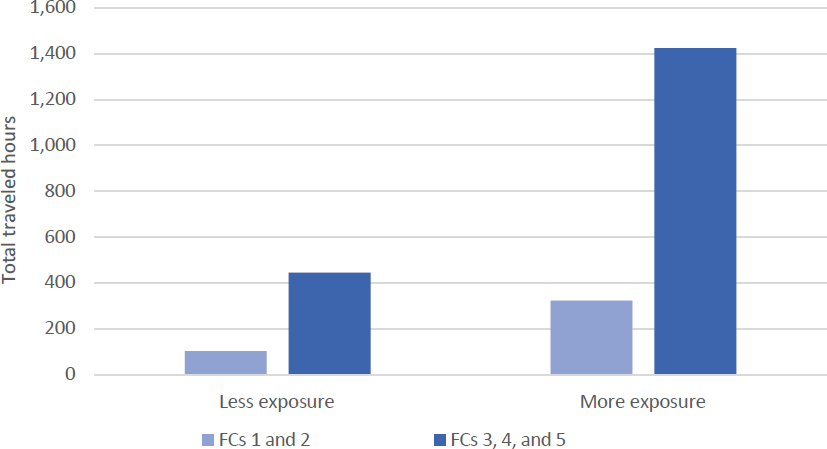
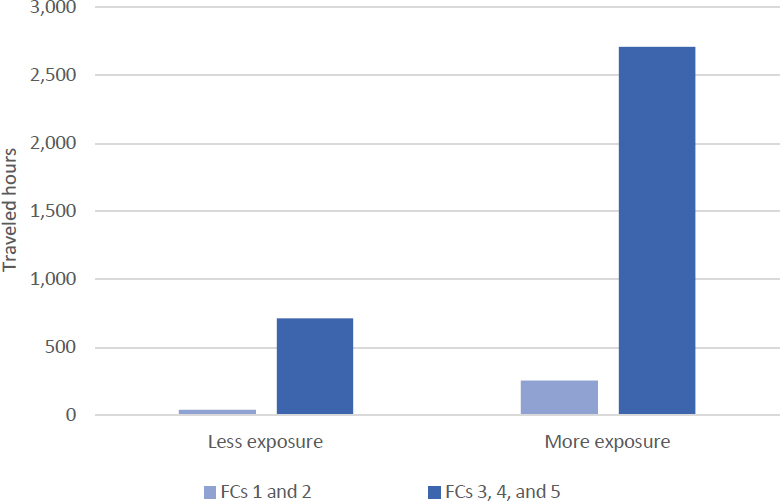
The types of roadways upon which practice driving occurred were also evaluated. Figure 10 shows the total hours of practice that occurred on either controlled-access highways or higher-speed highways (FCs 1 and 2) versus arterials, commercial connectors, and residential streets (FCs 3, 4, and 5). Teen drivers tended to spend more time on arterials, connectors, and residential streets as opposed to controlled-access or higher-speed highways. Both driving exposure groups practiced on controlled-access/high-speed roadways for approximately 18% of their practice hours; approximately 81%–82% of their practice was on arterials, connectors, and residential streets. This translates to the more-driving-exposure teens receiving an average of 7.9 hours of practice on high-speed roadways whereas the less-driving-exposure teens received an average of 2.5 hours of practice on these higher-speed roadways.
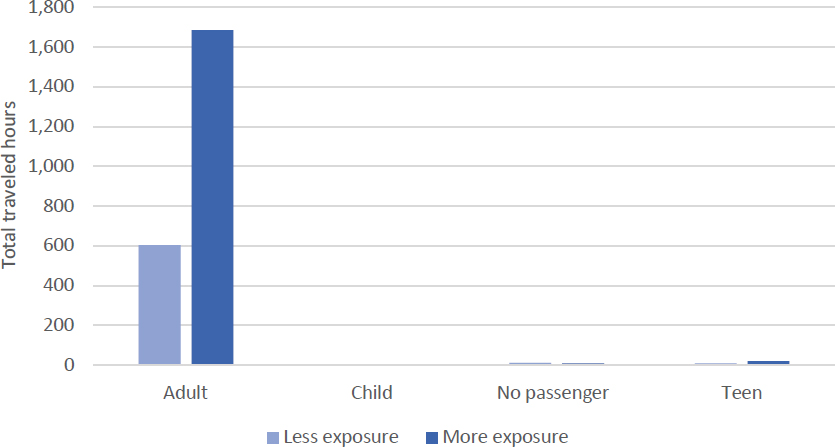
An adult was present during nearly all supervised practice driving time during the learner’s permit period (see Figure 11). Some trips also included passengers whose age was unknown. There were also some trips where the teen drove unsupervised, but the number of driving hours for these was low (24.03 total hours for the less-driving-exposure group and 33.78 total hours for the more-driving-exposure group).
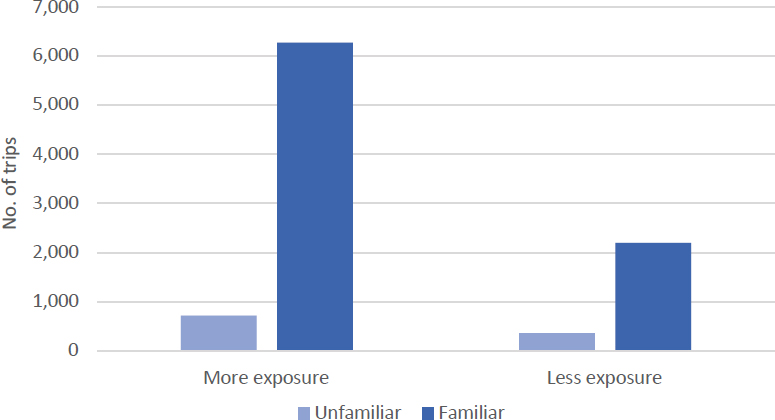
The research team categorized route familiarity during the learner’s permit phase into the categories of familiar and unfamiliar based on a binary familiarity score. For both driving exposure groups, the number of familiar routes was much greater than the number of unfamiliar routes. In the more-driving-exposure group, 89.77% of trips were familiar, while in the less-driving-exposure group, 86.04% of trips were familiar. Teen drivers tended to mainly practice driving on familiar roads as opposed to unfamiliar roads (see Figure 12).
To expand on this, the percentage of unfamiliar road trips in the learner’s permit phase was higher than in the early independent driving phase (see Figure 13). For the less-driving-exposure
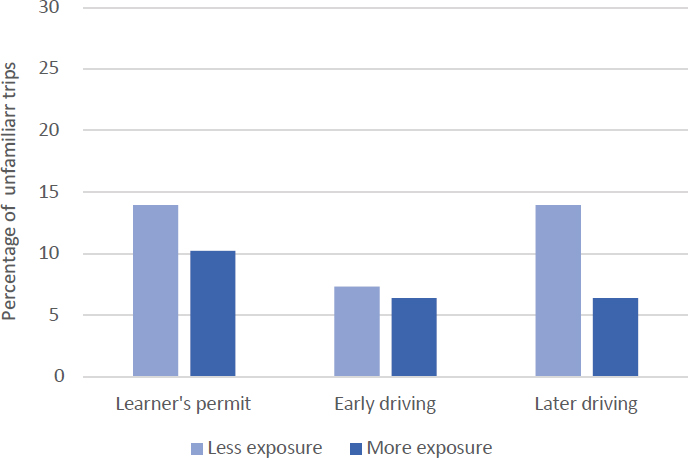
group, the percentage of unfamiliar trips rose in the later independent driving phase. For the more-driving-exposure group, the percentage of unfamiliar trips was similar in both the early and later independent driving phases.
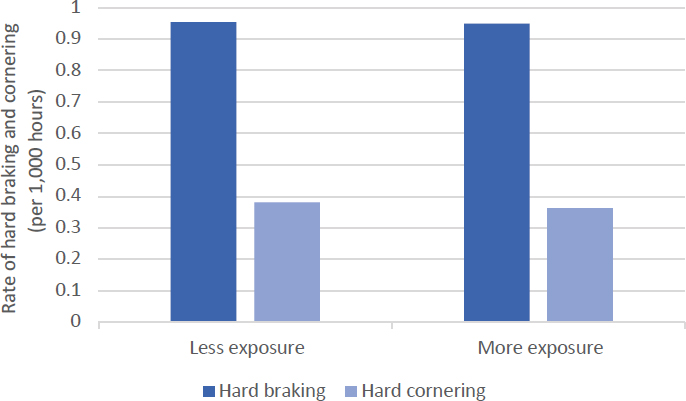
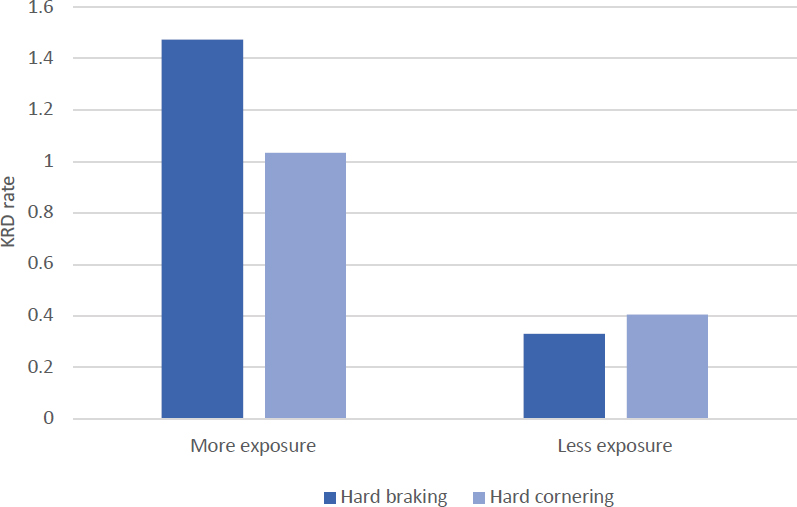
Figure 14 shows the rate of hard braking and hard cornering behaviors that were captured during practice driving for both exposure groups. These are rates calculated using the total number of hours traveled. While the more-driving-exposure group traveled many more hours than the less-driving-exposure group, the rates of hard braking and hard cornering events were similar for the two groups during the learner’s permit phase.
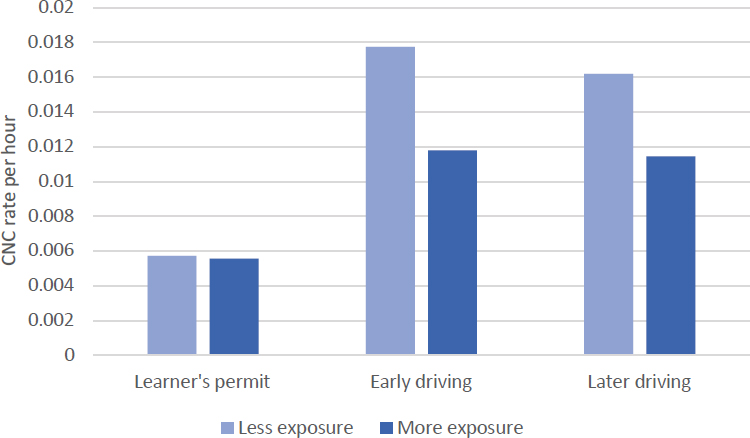
While CNC rates were lower during the learner’s permit phase than they were in the early and later independent driving phases, it is interesting to note that the CNC rates during the learner’s permit phase were similar for both groups (see Figure 15). In the early and later independent driving phases, the CNC rate in the more-driving-exposure group was lower than in the less-driving-exposure group. Teens with more exposure to driving during the learner’s permit phase had lower CNC rates in early and later independent driving phases.
Comparison of Driving Exposure Groups During the Early Independent Driving Phase (SHRP 2)
For the SHRP 2 NDS drivers, no data were collected during the learner’s permit phase of driving. Therefore, the early driving period was the first 6 months of driving independently with a provisional license. Using a technique similar to that used for assigning participants to the more-driving- and less-driving-exposure groups for the SPDS, for the SHRP 2 NDS, the research team determined the median hours traveled, and drivers who drove more than this median number of hours were assigned to the more-driving-exposure group. Those with a smaller number of hours driven in the first 6 months were assigned to the less-driving-exposure group. Please note that most of these participants’ vehicles were instrumented at some point during their first 6 months of independent driving, and thus a full 6 months of early independent driving was not available for any of these participants.
During the first 6 months of driving, there were 333.24 total traveled hours in the less-driving-exposure group and 1,277.61 in the more-driving-exposure group. These total hours represent an average of 8.4 hours of driving for the less-driving-exposure participants during early independent driving and an average of 44.8 hours of driving for the more-driving-exposure participants.
The breakdown by sex for SHRP 2 NDS teen drivers in each exposure group is provided in Table 2. More teen females agreed to participate in the SHRP 2 NDS earlier in their driving experience than teen male drivers. While there were more females in each group, the ratio of females to males in each driving exposure group was similar (18:10 for less driving exposure and 16:11 for more driving exposure).
Figure 16 shows the breakdown of daytime to nighttime hours traveled for both the less-driving-exposure and more-driving-exposure groups. The percentage of total hours traveled at night was approximately 12% for both less-driving-exposure and more-driving-exposure groups. The total number of hours traveled at night for the less-driving-exposure group was 26.8 hours compared to 158.9 hours for the more-driving-exposure group.
The total hours traveled by weekend and weekday were also calculated for both the less-driving-exposure and more-driving-exposure groups (see Figure 17). For both groups, approximately 25% of hours traveled were on weekends versus weekdays. This represents a slightly higher frequency of driving on weekends compared to weekdays but is more balanced than the 40% of all miles traveled on weekends that were observed for the SPDS learner’s permit period.
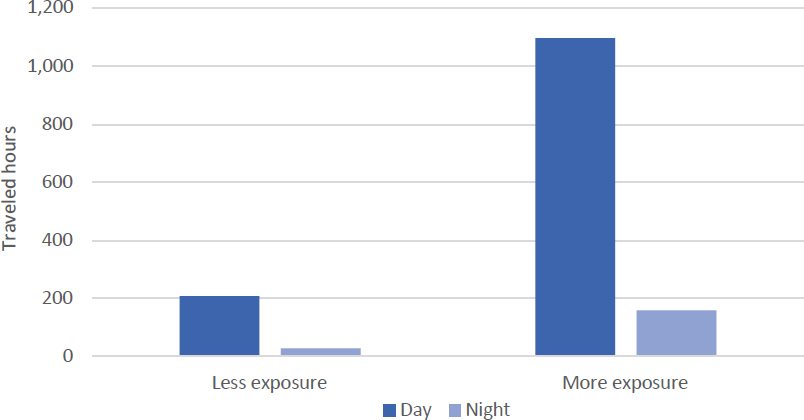
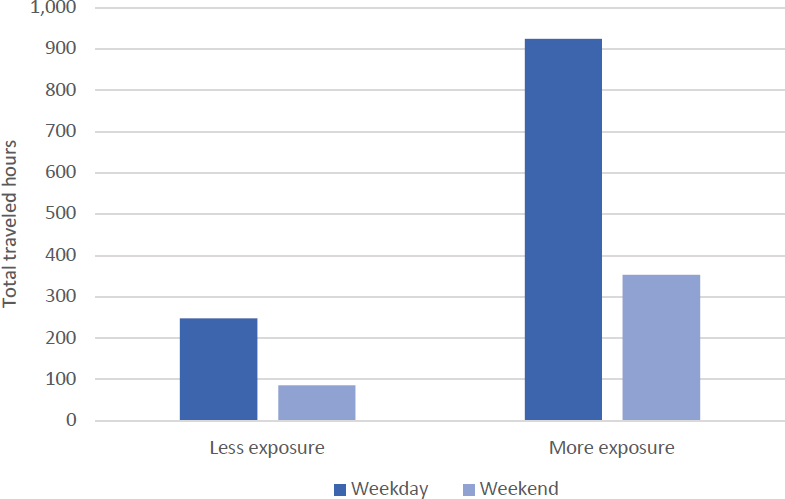
Figure 18 shows the total hours of driving that occurred on either controlled-access highways or higher-speed highways (FCs 1 and 2) versus arterials, commercial connectors, and residential streets (FCs 3, 4, and 5). The vast majority of driving hours were on arterials, connectors, and residential streets, all of which have lower speed limits. For both the less-driving-exposure and more-driving-exposure groups, approximately 90% of driving was on these lower-speed roadways, whereas ∼9% of hours traveled was on controlled-access and high-speed highways.
Figure 19 shows the CNC rates for the less-driving-exposure and more-driving-exposure groups during the early independent phase of driving. While Figures 16–18 have made it clear that total hours traveled for the less-driving-exposure group were fewer than total hours
traveled for the more-driving-exposure group, the CNC rates for the less-driving-exposure group were higher than those for the more-driving-exposure group. This is similar to the pattern observed for the SPDS teen drivers in independent driving phases.
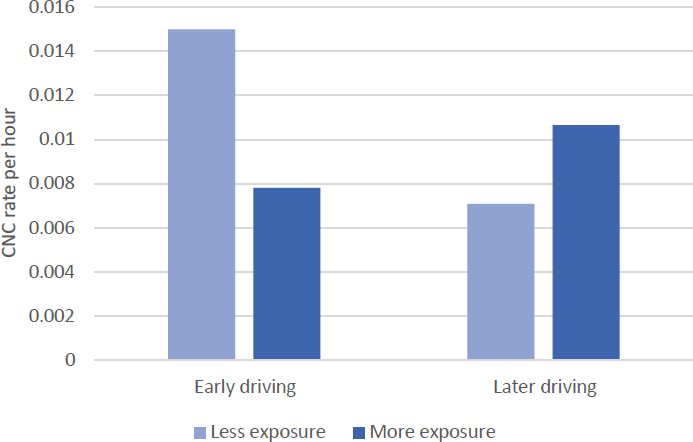
In the later independent driving phase, the more-driving-exposure group had a higher CNC rate than the less-driving-exposure group, as opposed to in the early independent driving phase (see Figure 19). The two driving phases are continuous. Teens with more driving exposure in the early independent driving phase had a higher CNC rate than the less-driving-exposure group in the later independent driving phase.
During the early independent driving phase, the KRD rate was higher in the more-driving exposure group than in the less-driving-exposure group (see Figure 20).
Research Objective 1a
Research Objective 1a was to evaluate how exposure to driving in diverse traffic and road environments earlier in the learning-to-drive process is associated with crashes and/or other safety surrogates (e.g., near-crashes, elevated g-force events) in later independent driving. The research team used only SPDS NDS data to address the primary question of whether the amount of driving exposure during learner’s permit and early independent driving phases impacts outcomes during later independent driving. This decision was made due to the differences in the amount of data collected on the earliest phases of driving in the two studies. The SPDS NDS had a fairly complete set of data for the learner’s permit and early independent driving phases, whereas the SHRP 2 NDS had no data for the learner’s permit phase and limited driving data for the first 6 months post licensure.
Statistical Model
To compare driving exposure in the learner’s permit phase and early independent driving to safety outcomes in later independent driving, the research team first grouped the participants into more and less driving exposure based upon learner’s permit and early independent driving experience, as described above. Safety outcomes were evaluated using CNC occurrence as well as KRD events (i.e., elevated g-force events). For example, the safety of SPDS drivers, based upon their driving experience obtained during the learner’s permit phase, was measured using the equation below.
The statistical inference for the CNC rate comparison was conducted via a state-of-the-practice Poisson regression model. The model assumption was not violated since the mean value of the CNC count was 0.0027 while the variance was 0.0028. Note that in this study, fixed-effect Poisson models were employed because some covariates (e.g., driving phase, exposure group, speed, and sex) were created based on participants’ demographic information and/or driver behaviors to understand their influence on traffic safety. As such, the individual-specific characteristics can be reflected by these covariates of interest. Including the between-subject variability in this model resulted in several potential issues, including model misspecification, convergence problems, and biased or inefficient estimates; therefore, the between-subject variability was not included in the model.
CNC: Driving Phase × Exposure Group × Sex × Vehicle Access
Previous sections of this report simply analyzed the association between CNC rate and exposure groups, as well as exposure groups’ differences under diverse environmental situations. In the fixed-effect Poisson regression model, driving exposure variables, driving diversity variables, and sex were combined to analyze the SCE rate. These variables are listed in Table A-4 in the appendix.
The Poisson regression model indicated that the CNC rate was lowest during the learner’s permit phase, was nominally highest during the early independent driving phase, and dropped slightly in the later independent driving phase. During the three driving phases, the CNC rate for males was generally higher than the CNC rate for females. Additionally, teen drivers in the more-driving-exposure group had lower CNC rates than did the teen drivers in the less-driving-exposure group. In particular, females in the less-driving-exposure group had a higher CNC rate compared
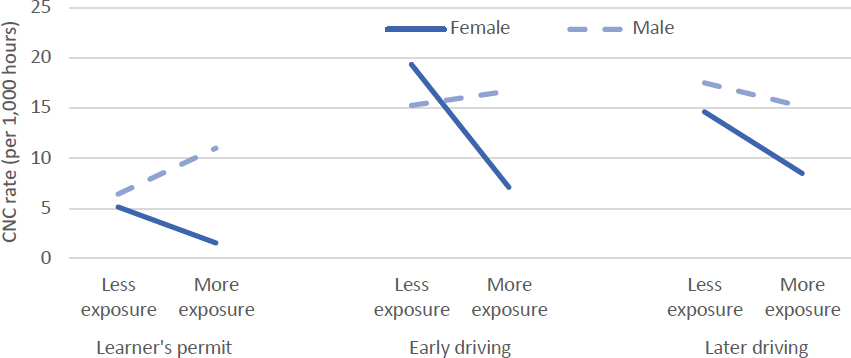
to the more-driving-exposure group in three driving phases, whereas males had a higher CNC rate in the more-driving-exposure group compared to the less-driving-exposure group during the learner’s permit and early independent driving phases. Females in the less-driving-exposure group in the early independent driving phase had the highest CNC rate compared to other driving phases. Less driving exposure or more driving exposure during the three phases did not impact male drivers as much as it impacted females (see Figure 21).
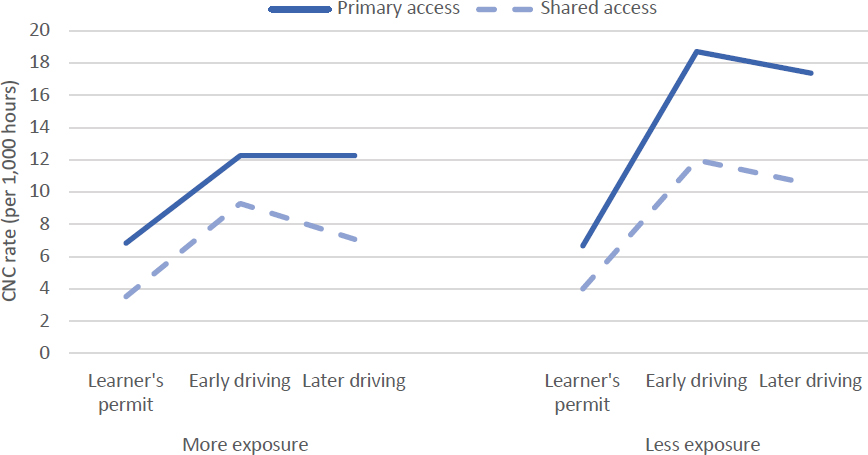
CNC rates were highest for teen drivers who had primary access to a vehicle, mostly in the early and later independent driving phases (see Figure 22). This was more pronounced for the less-driving-exposure group than the more-driving-exposure group.
KRD: Driving Phases × TOD × DOW × Route Familiarity
TOD and DOW were not significant in the Poisson regression model using CNC; the research team evaluated these factors using KRD event rates. CNCs were infrequent and thus it was difficult to assess some variables that may have required a more sensitive dependent measure. KRD event rates are more frequent and have previously been found to be associated with CNC
occurrence (Simons-Morton et al. 2012). Thus, if significant results are found with KRD events, it is hypothesized that these relationships would be present using CNC rates with a larger sample of drivers. All dependent and independent variables in the regression model are listed in Tables A-5 through A-8 in the appendix.
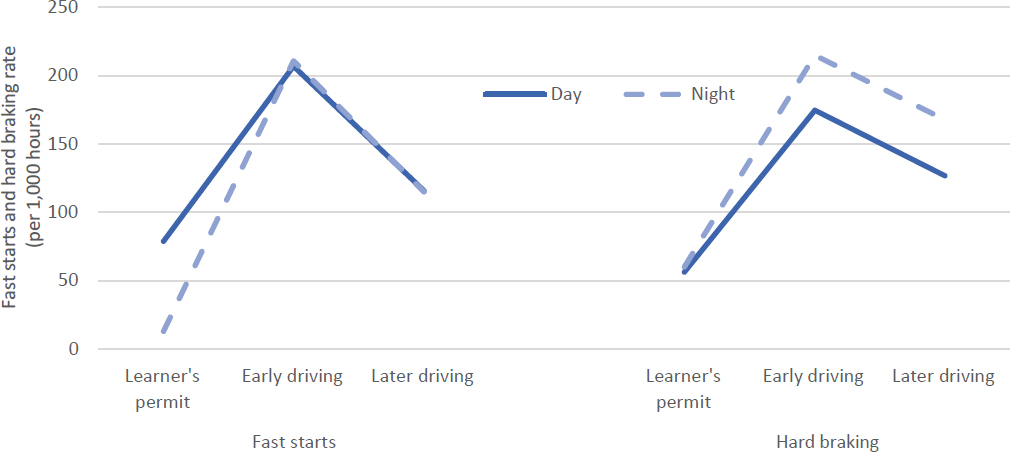
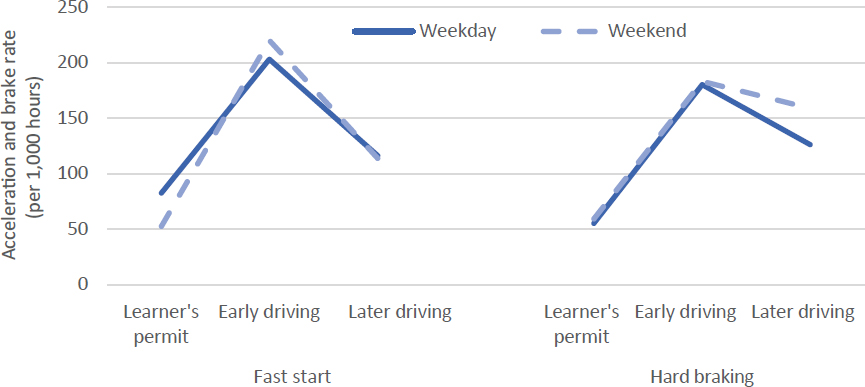
Figure 23 shows hard braking rates by TOD for each phase of driving. The Poisson regression model indicated that hard braking events occurred more frequently during nighttime driving, which may also suggest that nighttime driving is higher risk. Hard braking also occurred significantly more frequently during early and later independent driving phases compared to the learner’s permit phase. As opposed to hard braking, fast starts occurred more frequently during the early independent driving period than during the learner’s permit period; however, the high fast start rates were not significantly different by TOD.
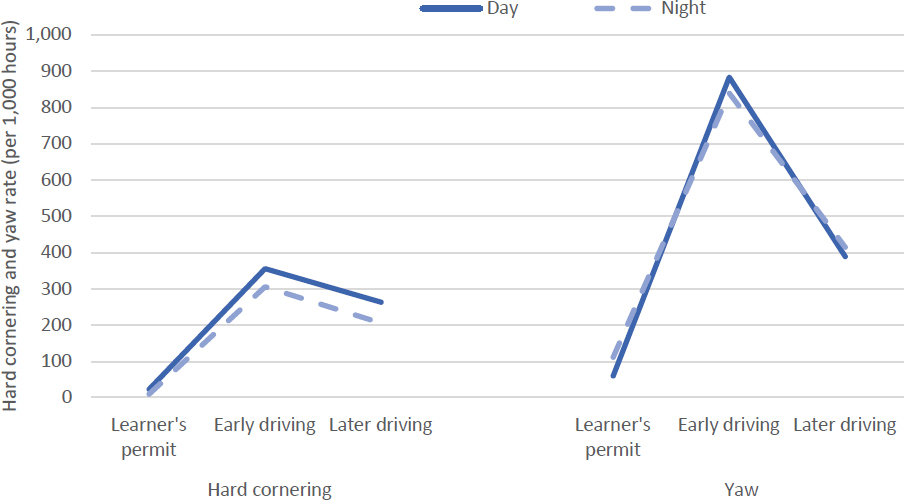
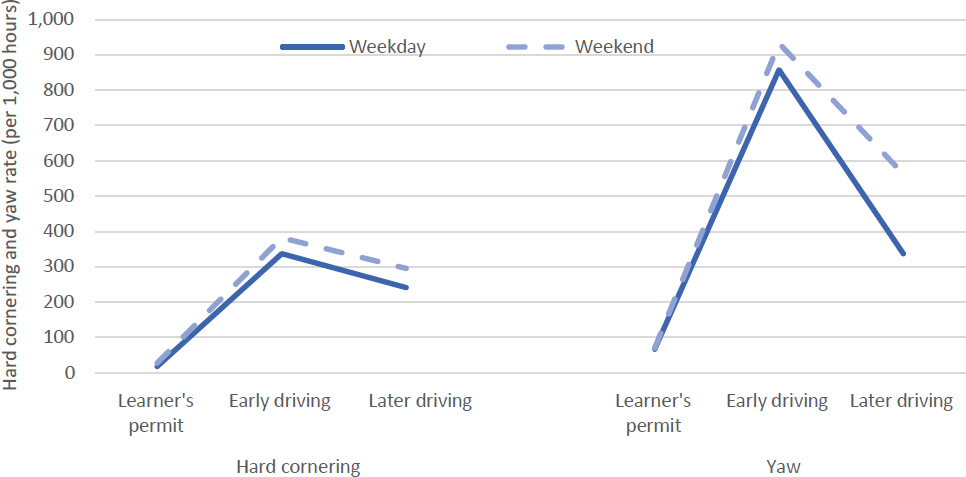
Figure 24 shows the Poisson regression results for hard cornering and the yaw rate. While the result by TOD was significant, hard cornering occurred more frequently among teens during the day versus at night. Hard cornering also occurred significantly more frequently during the early and later independent driving phases as compared to during the learner’s permit phase. For the yaw rate, similar results were observed during the early and later independent driving phases as compared to during the learner’s permit driving phase. However, yaw rates were not significantly different by TOD.
DOW
The Poisson regression model indicated that hard braking occurred significantly more frequently during early and later independent driving phases than during the learner’s permit phase (Figure 25). Neither the hard braking rate nor the fast start rate was significantly different by DOW.
Hard cornering occurred more frequently among teens with either more or less exposure to weekend driving in the early and later independent driving phases. For the yaw rate, similar results were observed for early and later independent driving as compared to during the learner’s permit driving phase. During the learner’s permit phase, the hard cornering rate and yaw rate were not significantly different by DOW (Figure 26).
Route Familiarity
The Poisson regression model indicated statistically significant differences for the longitudinal accelerations of fast starts and hard braking events. Accelerations occurred more frequently on familiar routes than on unfamiliar routes. Conversely, teens had more hard braking events on unfamiliar routes than on familiar routes.
Since there was no learner’s permit data, and/or early independent driving was not a complete 6 months of data in SHRP 2 NDS, the research team did not compare early independent driving exposure to later safety outcomes.
Research Objective 1b
Research Objective 1b was to evaluate how exposure to driving in diverse traffic and road environments earlier in the learning-to-drive process is associated with variability in teen driver behavior or safety-relevant performance measures in later independent driving, corrected/normalized for exposure. This section evaluates whether the prevalence of known teen risky driving behaviors is impacted by the amount of driving exposure or diversity during the learner’s permit phase.
SPDS
Speeding
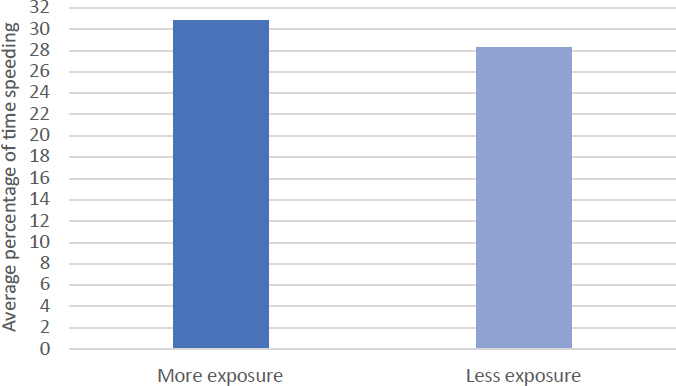
The average percentage of time speeding was 30.75% in the more-driving-exposure group, compared to 28.32% in the less-driving-exposure group (Figure 27). Although the more-driving-exposure group exhibited slightly more frequent speeding, the t-test results (t = 1.66, p > 0.5) showed that the difference in percentage of time speeding between the two exposure groups was not significant.
There were no significant differences in the average percentage of time speeding between the early independent driving and later independent driving phases. In the less-driving-exposure group, the average percentage of time speeding in the early independent driving phase was similar to that in the later independent driving phase. For the more-driving-exposure group, the percentage of time speeding was higher in later independent driving than in early independent driving.
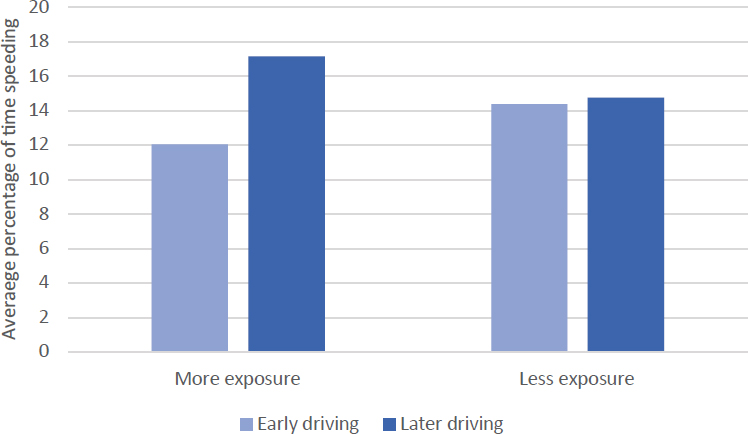
The average percentage of time speeding was highest for the later independent driving phase in the more-driving-exposure group as compared to the less-driving-exposure group (Figure 28).
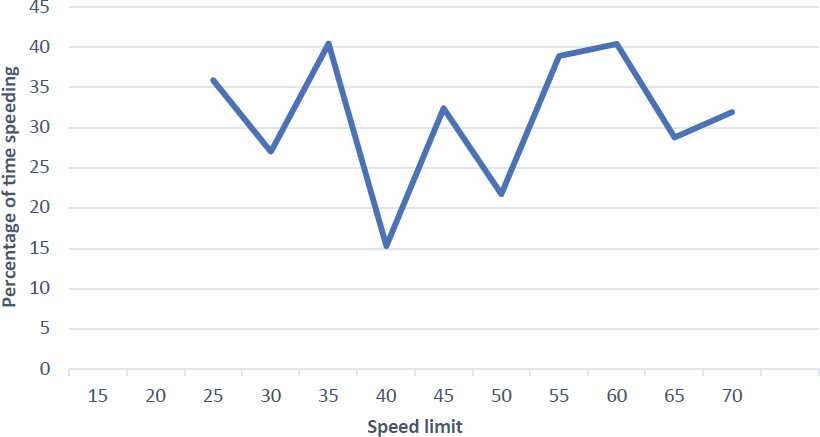
Teen drivers exhibited more speeding behaviors when the speed limits were 25, 35, 45, 55, and 60 mph as compared to other speed limits. At speed limits of 35 and 55+ mph, approximately 40% of driving time involved speeding (see Figure 29).
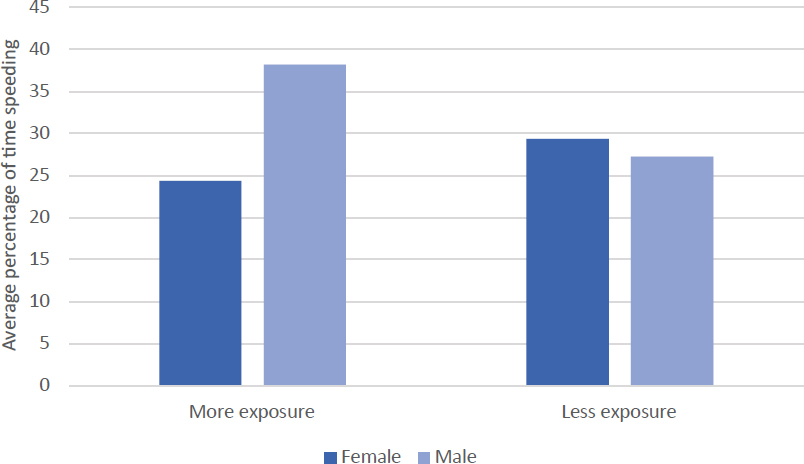
Figure 30 shows the speeding time breakdown by sex for each driving exposure group. In the less-driving-exposure group, the percentage of time speeding for males was akin to that of females, whereas males engaged in more speeding behavior than females in the more-driving-exposure group.
Table 3 shows the results of a quasibinomial regression model analyzing the odds of speeding across various factors. The first column lists the predictor variables and their comparisons, while the subsequent columns provide the estimated odds (estimates), the 95% confidence intervals,
and the corresponding p values. Drivers in the first 6 months of independent driving (≤ 6 m) had 3.507 times higher odds of speeding compared to during the learner’s permit phase. Similarly, those in the later independent driving phase had 3.907 times higher odds of speeding compared to those in the learner’s permit phase. The odds of speeding for the less-driving-exposure group were 0.781 times greater than those for the more-driving-exposure group, indicating a lower likelihood of speeding. The odds of speeding during the weekend were 1.120 times higher than during the weekday. There was no significant difference in the odds of speeding on unfamiliar versus familiar routes.
Passenger Presence
The chi-square analysis indicated a significant difference in passengers across driving phases and between driving exposure groups (p < 0.01). Adults accounted for nearly 90% of passengers in the learner’s permit phase but that percentage decreased significantly to less than 8% in the early and later independent driving phases (see Table 4). In the early and later independent driving phases, most often there were no passengers or there were teen passengers. Of particular interest is the percentage of trips during which adults rode with teens in the first 6 months of independent driving. A chi-square analysis indicated that adults rode with more-driving-exposure teen drivers significantly more frequently than with less-driving-exposure teen drivers (Χ = 185.8 (1), p < 0.05).
Table 3. Speeding odds ratio estimate, confidence interval (CI), and p value (SPDS).
| Speeding (predictor variables and comparisons) |
Estimate | 2.5% CI | 97.5% CI | p |
|---|---|---|---|---|
| Phase: ≤ 6 m vs. Learner’s Permit | 3.507 | 3.203 | 3.847 | 0.000 |
| Phase: 6–12 m vs. Learner’s Permit | 3.907 | 3.566 | 4.289 | 0.000 |
| Exposure: Less vs. More | 0.781 | 0.746 | 0.817 | 0.000 |
| TOD: Night vs. Day | 1.022 | 0.961 | 1.085 | 0.490 |
| DOW: Weekend vs. Weekday | 1.120 | 1.066 | 1.176 | 0.000 |
| Familiarity: Unfamiliar vs. Familiar | 0.934 | 0.843 | 1.032 | 0.183 |
Table 4. Passenger presence by passenger type, driving phase, and exposure group.
| Passenger Type | More Exposure | Less Exposure | ||||
|---|---|---|---|---|---|---|
| Learner’s permit | Early driving | Later driving | Learner’s permit | Early driving | Later driving | |
| Adult | 6,634 | 1,348 | 491 | 2,628 | 476 | 203 |
| Child | 6 | 385 | 353 | 197 | 224 | |
| No passenger | 88 | 9,554 | 8,675 | 81 | 7,409 | 7,257 |
| Teen | 103 | 2,706 | 2,186 | 55 | 2,284 | 2,426 |
The CNC rate with an adult passenger present was the lowest, while the CNC rate with no passenger present was the highest. In general, the CNC rate in the more-driving-exposure group was lower than in the less-driving-exposure group (Figure 31).
Seatbelt Use
Driver seatbelt use was consistently high, ranging from 95% to 99%, with no differences across the three driving phases. However, the seatbelt use percentage was nominally lower in the more-driving-exposure group than in the less-driving-exposure group (see Figure 32).
SHRP 2
Passenger Presence
In the early independent driving phase, the percentage of adult passengers was 17.40% in the less-driving-exposure group and 4.67% in the more-driving-exposure group (see Table 5). Also, the percentage of adults as passengers decreased from the early independent driving phase to the later independent driving phase for the less-driving exposure group. In the two independent driving phases, teens driving without passengers accounted for the highest percentage. For the teen passengers, the percentage increased with more driving exposure.
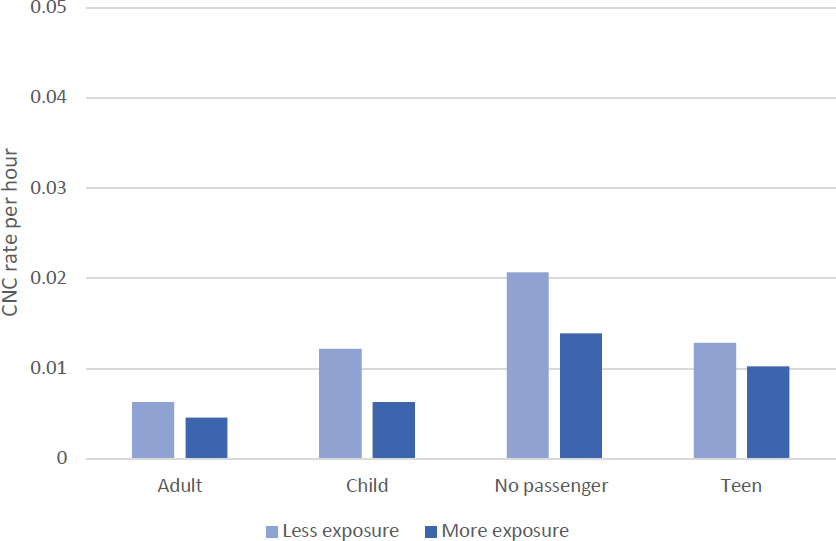
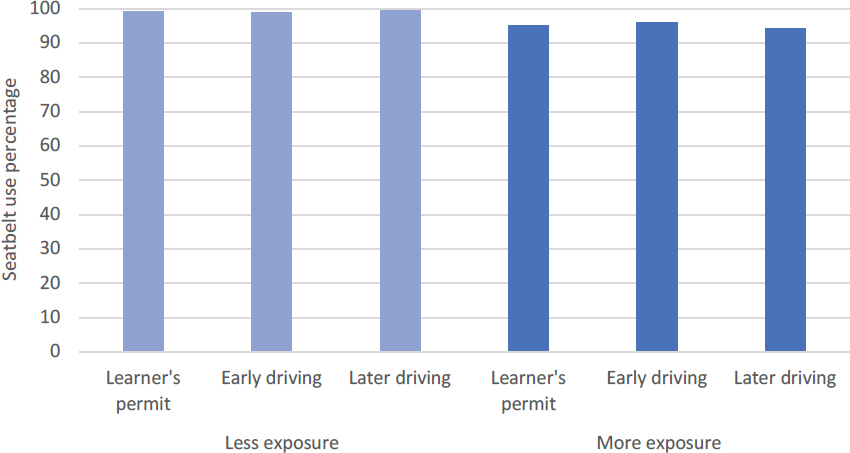
Table 5. Percentage of passenger types by exposure group and driving phases (SHRP 2).
| Passenger Type | Less Exposure | More Exposure | ||
|---|---|---|---|---|
| Early driving | Later driving | Early driving | Later driving | |
| Adult | 183 (17.40%) | 160 (2.58%) | 182 (4.67%) | 239 (3.88%) |
| Teen | 217 (20.63%) | 1,380 (22.29%) | 1,211 (31.06%) | 2,062 (33.47%) |
| No passenger | 617 (58.65%) | 4,559 (73.63%) | 2,416 (61.96%) | 3,728 (60.52%) |
The CNC rate in the less-driving-exposure group was higher than in the more-driving-exposure group during the early independent driving phase. Compared to teen passengers, adult passengers were correlated with a slightly higher CNC rate in the more-driving-exposure group but not with the less-driving-exposure group (see Figure 33).
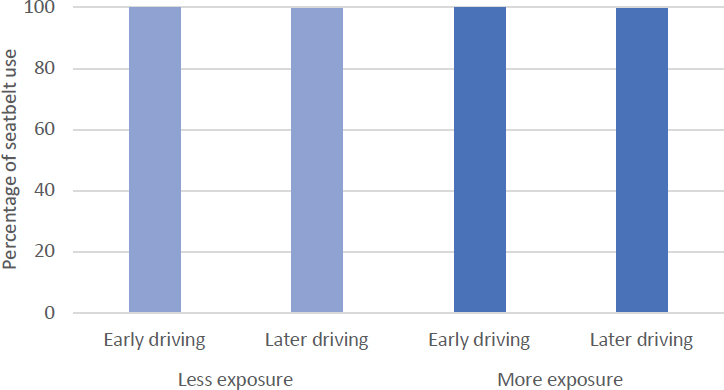
Seatbelt Use
Driver seatbelt use was nearly 100%, with no significant differences observed across the two driving phases or between the two exposure groups (see Figure 34). All teen drivers tended to obey the law and use seatbelts.
Research Objective 2
Research Objective 2 was to develop recommendations/strategies for improving teen driving safety for State Highway Safety Offices. Despite the challenges in accessing the naturalistic driving data needed to fully test the research hypotheses of this project, the findings suggest some potential changes in how graduated driver’s licensing programs are implemented that would be likely to improve teen driver performance and safety. These changes could include a combination of required and voluntary components. The overall objectives of the changes would be to increase the exposure of teen drivers to nighttime operations early on in driving, broaden their exposure beyond a small number of often-traveled routes, and expose them to
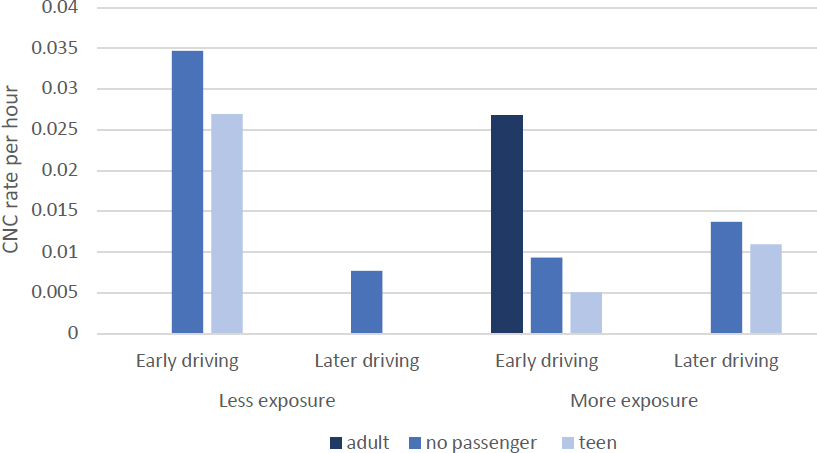
Figure 33. CNC rate with passengers by exposure group and driving phase (SHRP 2).
a wider variety of road and traffic characteristics. To achieve these objectives, the following proposals should be considered:
- Maintain or increase the number of hours of supervised practice driving during the learner’s permit period, including explicit targets for a percentage of such driving to take place during nighttime and on unfamiliar routes. A target of 25% may be appropriate for each; however, for any given jurisdiction, officials must consider what is practical for jurisdiction residents.
- Put in place and enforce requirements for improved documentation of supervised driving time/experience. This could be accomplished via a state-provided “supervised driving app” to be downloaded to the teen’s and parent’s smartphones—with appropriate privacy controls—that creates time-stamped, continuous driving history files that can be provided to the licensing authority when the supervised driving phase is completed and the teen wishes
- to graduate to independent driving. If requiring improved documentation of supervised drive time/experience proves impractical due to statutory or other barriers, it may also be accomplished through partnerships with automobile insurance providers, who already offer monetary incentives to drivers who share information about their driving experience through electronic data recorders and other means.
- Provide additional educational materials to parents that underscore the expected payoff of ensuring that their teens’ initial driving experience is broadened to include the targets suggested above and that promote the idea that teen driver training does not abruptly end when the state’s minimum learner’s permit driving requirements have been met, i.e., parents should make it a habit to occasionally ride with the newly-independent teen driver.
Summary of Findings
The purpose of this research was to evaluate how exposure to driving during the learner’s permit phase and/or the first months of driving independently) impacts safety outcomes in later independent driving. Second, the researchers aimed to determine whether exposure to diverse traffic and road environments earlier in the process of learning to drive was associated with safety outcomes and performance differences that are safety relevant during later, independent driving, Finally, the goal was to use these results to develop actionable recommendations for State Highway Safety Offices.
To address these objectives, the research team used two NDS datasets. The first dataset was the SPDS, which followed a cohort of teenage drivers from the learner’s permit phase to the end of the first year of independent driving. The second dataset was a SHRP 2 study, from which the researchers sampled only the teenage drivers. Driving data in SHRP 2 began being recorded at licensure and continued being recorded for up to 2 years of independent driving.
A new finding from this study was that teens who had accumulated more practice driving during the learner’s permit phase had significantly lower SCE rates during independent driving phases relative to those teenagers who had little practice driving during the learner’s permit phase. This association was particularly pronounced for females. Female teens with less driving exposure during the learner’s permit phase experienced higher SCE rates during the early independent phase relative to males. This is the first analysis to find statistically significant results indicating that more practice during the learner’s permit phase does reduce CNC involvement for the teen driving population and has direct implications for policy and practice.
Another key finding from this study was that teenage drivers with primary access to a vehicle had higher SCE rates than those teens who shared a family vehicle. This was especially pronounced for teen drivers who had accumulated less practice driving during the learner’s permit stage. This result is an important finding that should be included in educational materials for parents of teen drivers and driver’s education instructors.
To understand factors associated with driving diversity, the research team used a range of measures, including TOD, DOW, and a novel measure, route familiarity, which captured whether the individual had driven a particular route before. The research findings confirm that teens had higher rates of hard braking events on unfamiliar routes and higher rates of fast starts on familiar routes. Hard braking events were associated with higher SCE occurrence. These results suggest that more exposure to diverse routes during the learner’s permit and early independent driving phases can improve safety.
Speeding behavior was highly prevalent among teenage drivers during independent licensure. While speeding occurred at every speed limit, it was most prevalent on roads with 35, 55, and 60 mph speed limits. These results also have direct implications for policy and practice,
as speed is highly associated with crash rates (Ferguson 2013). More focused attention on teen driver speeding behavior on highways and in residential areas and enforcement during key time periods during the academic year (e.g., the beginning of school year, high school events) could help curb this behavior.
Parental supervision in the vehicle during the learner’s permit period was very high, with only a small number of trips (less than 5%) where the teen driver was without supervision. The level of supervision plummeted during independent driving. Additionally, parents were significantly less likely to ride with teens who had less practice than with teens who had more practice. This result also suggests that information should be provided to parents of teen drivers and driver’s education instructors on the importance of parents riding with their teens both during the learner’s permit period and early independent driving.


