Guidelines for Evaluating Crashworthiness of Sign Supports and Breakaway Luminaire Poles (2024)
Chapter: 6 Investigation of Luminaire Pole and PSST Crash Tests and Simulations
CHAPTER 6
Investigation of Luminaire Pole and PSST Crash Tests and Simulations
As described in the previous chapters, a total of two full-scale crash tests were conducted on steel luminaire poles supported on the TB1-17 transformer base, while five tests were carried out on 2¼-in. × 2¼-in., 12-gauge PSST posts. After the crash testing, the LS-DYNA simulations were validated using the test data, leading to significant improvements in the accuracy of predicting the impact behavior of these devices. However, the validation process is incomplete without running the full set of tests. For instance, the simulations for luminaire poles representing MASH Test Nos. 3-61 and 3-62 impact conditions lack full-scale crash test data for validation, and the outcomes for the PSST post testing were not consistent, which makes it challenging to develop guidelines and suggest modifications to MASH for these systems. Thus, the concept of identifying a family and utilizing a reduced test matrix to determine crashworthiness could not be fully demonstrated.
However, despite these challenges, the research team closely analyzed all available crash test data along with the simulation results. This thorough examination allowed for a better understanding of the performance and behavior of the tested devices under various impact conditions. The information serves as a foundation for future research and potential improvements in the development of guidelines and MASH modifications.
Furthermore, with the implementation of the improved simulations of the luminaire pole, the research team conducted a rerun of simulations on the revised cases to update the observations and conclusions from Phase II. During Phase II, the simulations were validated against a few crash tests (FOIL crash Test Nos. 21011 and 21017 as well as two pendulum tests). However, the newly validated simulations enhanced the accuracy of the predictions. This approach helped identify configurations and impact conditions that were more critical. By incorporating validated simulations, the study offers more reliable insights and understanding of the crashworthiness of these devices.
6.1 Analysis of Luminaire Poles Supported by TB1-17 Transformer Base
6.1.1 Full-Scale Crash Testing – Luminaire Poles
All available crash test data were collected from FOIL, MwRSF, and TTI and are provided in Table 32. MwRSF crash tests, Test Nos. TBLP-1 and TBLP-2, were detailed in Chapter 2 of the current report. FOIL pendulum tests, Test Nos. 20009A and 20009B, as well as FOIL crash Test Nos. 21011 and 21017, were detailed in Interim Report No. 2 (Asadollahi Pajouh et al. 2022) and briefly described in Sections 3.5 and 3.6 of the current report, respectively. More recently, two full-scale crash tests were conducted at TTI on steel luminaire poles with a TB1-17 transformer base according to MASH Test No. 3-60 impact conditions. Note that the test report has not been
Table 32. List of available MASH crash tests on a steel luminaire pole with the TB1-17 transformer base.
| Test Name | Testing Facility | Type of Test | Designation | Pole Height (ft) | Single/Dual Arm | Mast Arm Length (ft) | Pole Thickness (in.) | Total Weight (lb) | Longitudinal OIV (ft/s) | Longitudinal ORA ( g) | Roof Crush (in.) | Pass/Fail |
|---|---|---|---|---|---|---|---|---|---|---|---|---|
| 20009A | FOIL | Pendulum test | N/A | 25 | Single | 8 | 11 ga. | 280 | N/A | 10.45 | N/A | N/A |
| 20009B | FOIL | Pendulum test | N/A | 50 | Dual | 10 | 0.13 in. | 668 | N/A | 11.2 | N/A | N/A |
| 21011 | FOIL | Full-scale | MASH 3-60 | 35 | Dual | 20 | 11 ga. | 815 | 13.5 | 0.91 | 1.1 | PASS |
| 21017 | FOIL | Full-scale | MASH 3-60 | 25 | Dual | 20 | 11 ga. | 781 | 11.8 | 1 | 2.7 | PASS |
| TBLP-1 | MwRSF | Full-scale | MASH 3-60 | 50 | Dual | 15 | 7 ga. | 1,015 | 17.8 | 1.2 | 0.2 | FAIL |
| TBLP-2 | MwRSF | Full-scale | MASH 3-60 | 30 | Single | 30 | 7 ga. | 824 | 31.7 | 1.6 | 0 | FAIL |
| 440862 -01-1 | TTI | Full-scale | MASH 3-60 | 50 | Dual | 10 | 11 ga. | 730 | 12.1 | Within MASH limit | 6 | FAIL |
| 440862 -01-2 | TTI | Full-scale | MASH 3-60 | 40 | Dual | 10 | 11 ga. | 553 | 22.6 | Within MASH limit | 5.8 | FAIL |
published and the research is not yet complete. The TTI crash test data were shared with the NCHRP Project 22-43 research team with the permission of the Texas Department of Transportation (TxDOT) for comparison of pole behaviors in similar impact conditions. For more details on the TTI crash tests and research effort, inquiries can be directed to the TTI research team. Figures 143 through 150 include images from testing performed under Project 0-6968 (not yet published) and are used with permission from TTI and TxDOT.
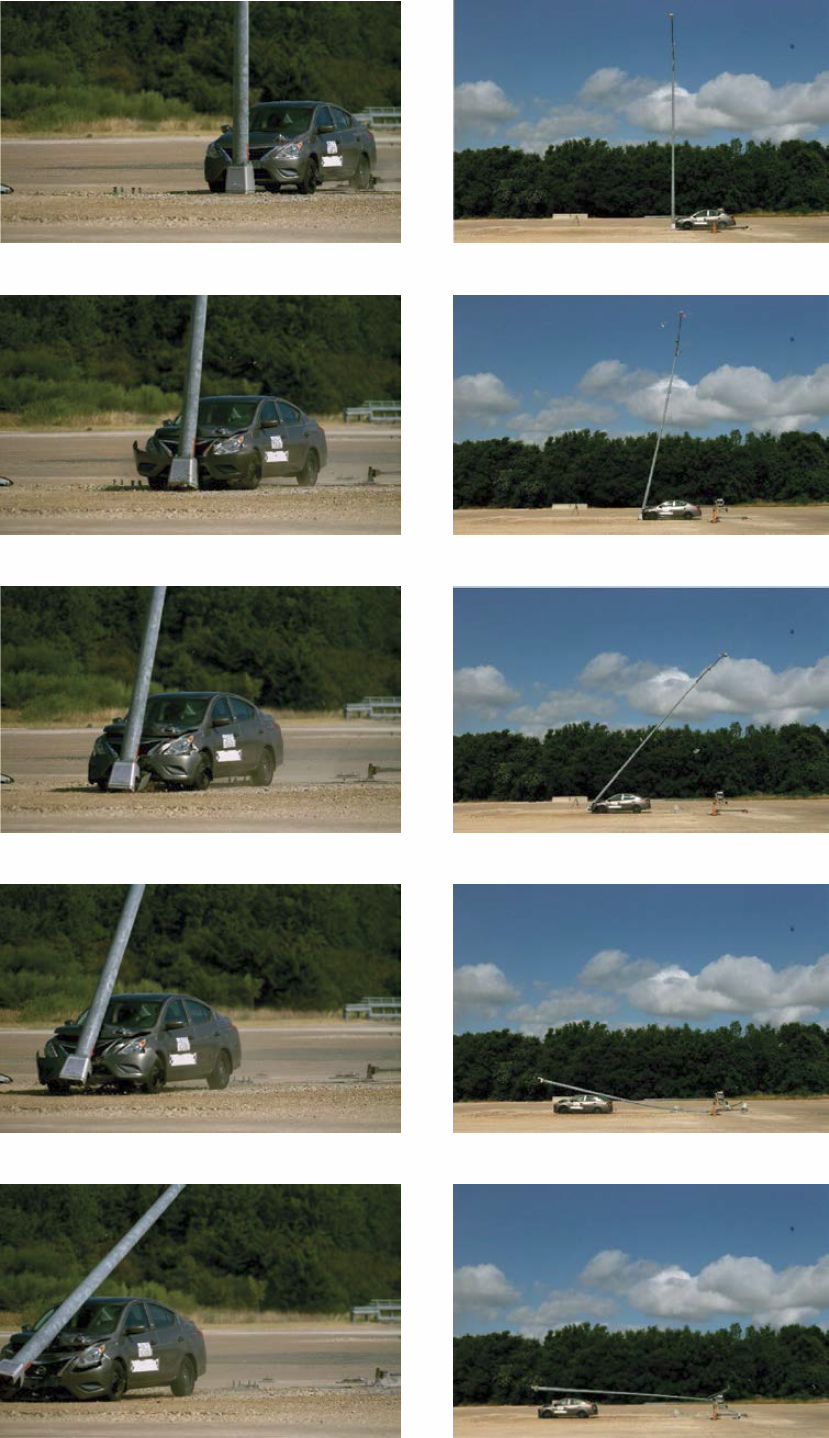
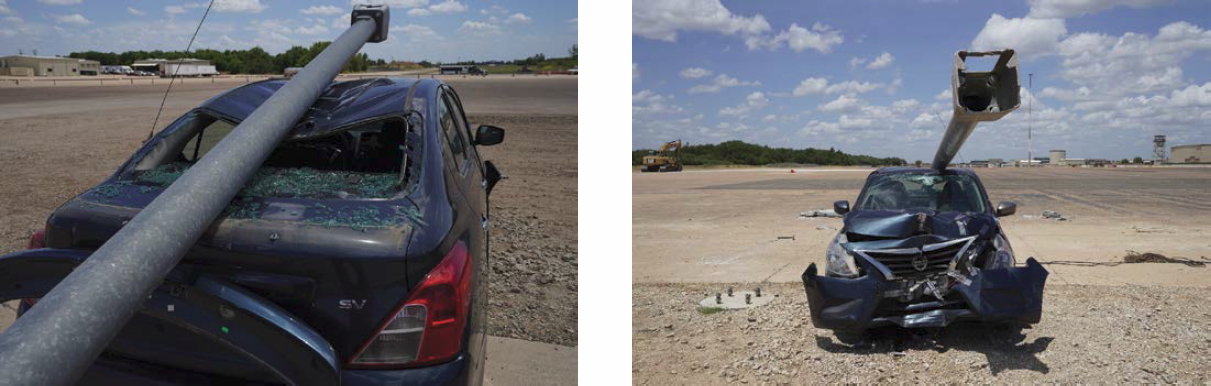
In the first TTI test, Test No. 440862-01-1, a 50-ft-tall pole with dual 10-ft-long mast arms was impacted by a small car (1100C) under MASH Test No. 3-60 impact conditions with a vehicle center impact point, as shown in Figure 143. The total system weight was 730 lb. Upon impact, the transformer base activated and fractured. The pole fell on the vehicle’s roof and caused a maximum roof crush of 6 in. toward the middle of the roof, which exceeded the MASH limit of 4 in., as shown in Figure 144. The rear window was also shattered. The vehicle damage and the sequential photographs are shown in Figures 145 and 146, respectively.
TTI Test No. 440862-01-1 was similar to the system tested in MwRSF Test No. TBLP-1, except for the arm length and the total system weight. In the TTI test, the dual mast arms measured 10 ft, while the MwRSF system had longer dual mast arms, extending to 15 ft. Additionally, the pole used in the TTI test had an 11-gauge wall thickness, resulting in a total weight of 730 lb. The MwRSF pole had a 7-gauge wall thickness to reach the maximum weight limit of 1,000 lb, leading to a total weight of 1,015 lb.
Both the MwRSF test and the TTI test failed to meet MASH criteria but showed distinct behaviors. In the MwRSF test, the base fractured, causing the pole to fall on the vehicle’s roof edge, resulting in a roof crush well below the MASH limit. However, the longitudinal OIV of 17.8 ft/s exceeded the MASH limit of 16 ft/s. Conversely, in the TTI test, the pole fell on the middle of the vehicle’s roof, causing a roof crush of 6 in., which exceeded the 4-in. MASH limit. Further, the longitudinal OIV in the TTI test measured 12.1 ft/s, which was within the MASH limit.


The inconsistent behavior of the poles after base fracture caused challenges in predicting roof crush through simulation. Furthermore, inaccuracy in the vehicle roof model added more complexity to the problem. Vehicle roof models used in simulations might not always provide precise predictions of roof crush when subjected to pole impact events. These challenges will be investigated in the continuation of the current project. On a positive note, the simulations that were validated against MwRSF and FOIL tests could effectively predict the OIV as one of the two failing concerns. More recently, the TTI test data became available to the research team, and these tests will be simulated to assess the capability of LS-DYNA models in predicting OIV using the TTI test results.
The second TTI test, Test No. 440862-01-2, used a 40-ft-tall pole with dual 10-ft-long mast arms and was impacted by a small car (1100C) under MASH Test No. 3-60 impact conditions with a vehicle center impact point, as shown in Figure 147. The total system weight was 553 lb. Upon impact, the transformer base activated and fractured. But the pole was standing stationary in front of the vehicle, then rolled across the top of the vehicle, resulting in a maximum roof crush of 5.8 in. (>4-in. MASH limit), as shown in Figure 148. The longitudinal OIV was 22.6 ft/s (>16-ft/s MASH limit). The test failed two MASH safety performance criteria. The vehicle damage and the sequential photographs are shown in Figures 149 and 150, respectively.


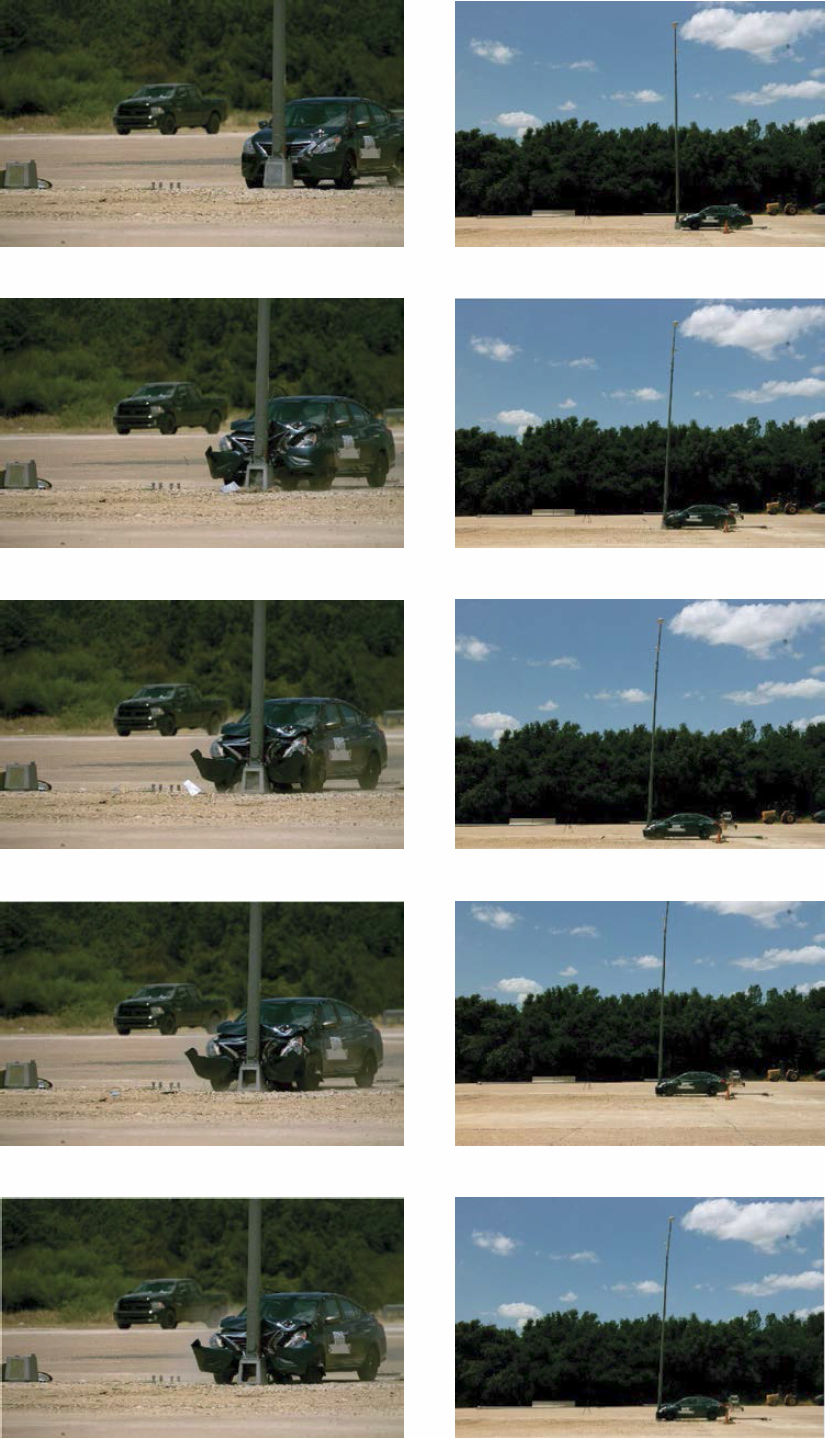
TTI Test No. 440862-01-2 provided additional unexpected outcomes. This test involved a system comparable to that examined in FOIL Test No. 21011. In the TTI test, a 40-ft-tall pole with 10-ft-long dual mast arms was used, while the FOIL test used a 35-ft-tall pole with longer dual mast arms extending to 20 ft. The total weights of the tested systems were 553 lb and 815 lb for TTI and FOIL, respectively. Unexpectedly, the TTI test failed to meet MASH criteria for both roof crush and OIV, while the FOIL system, with a larger weight and longer mast arms, passed all MASH criteria. This outcome can be due to the inherent variability in base fracture behavior and the inconsistencies in pole response during impacts. These outcomes challenge the historical belief that heavier poles cause more severe damage and demonstrate that shorter or lighter poles may also lead to test failures.
Given these observations, the research team would require conducting an in-depth analysis and running a comprehensive series of crash tests prior to making recommendations for reducing testing matrices for this luminaire pole family of devices. To provide more informed recommendations, the research team needs to further investigate a wide range of poles and crash scenarios for luminaire poles with the TB1-17 transformer base through full-scale crash testing and the validated LS-DYNA models. The continuation project can contribute to this objective to some extent by offering more full-scale crash tests and validated simulations.
6.1.2 Updated Computer Simulation – Luminaire Poles
As described in Chapter 3, the LS-DYNA model of the transformer base TB1-17 was revised using data obtained from several full-scale crash tests, material certifications, and precise measurements of the base. Subsequently, the updated base model was integrated into the luminaire pole models, and simulations were then rerun to reflect these changes.
The selected pole-arm configurations are listed in Table 33, which has additional pole configurations compared to the originally developed list in Phase II. In the initial selection of poles, the criteria were set to identify the most extreme cases. These cases included heaviest pole with a specific height, which in turn would have the maximum pole wall thickness (i.e., 11 gauge for 20-ft-tall poles, 7 gauge for 30- and 40-ft-tall poles, and 3 gauge for 50-ft-tall poles). In this phase, thinner poles were added to the selected pole list for simulations since the mass distribution significantly influenced the overall behavior of the poles in terms of breakaway behavior, roof crush, and OIV. Also, the variability in pole behavior required more data points for drawing more robust recommendations. In this round of simulation with the updated transformer base, the previously selected pole configurations with 30 and 40 ft heights were subjected to simulations involving two different pole wall thicknesses (i.e., 11 gauge and 7 gauge). For 50-ft-tall poles, simulations were conducted with three pole wall thicknesses: 10 gauge, 7 gauge, and 3 gauge. Simulations were carried out for poles weighing from 250 to approximately 1,200 lb.
Moreover, two additional cases, labeled as Case Nos. 78 and 79, were introduced into the numerical study. Both cases involve 30-ft-tall poles with different mast arm configurations. Case No. 78 is a 30-ft-tall pole with a single 20-ft-long mast arm, while Case No. 79 is a 30-ft-tall pole with dual 20-ft-long mast arms. These newly introduced cases were added to investigate the behavior of 30-ft-tall pole with shorter mast arms (20-ft mast arm as compared to Case No. 27 with 30-ft mast arm, which failed MASH 3-60 in Test No. TBLP-2). In the end, the total number of pole configurations was expanded from the previous count of 20 to a total of 39, as shown in Table 33.
For a majority of the pole configurations, similar to the first-round simulations (i.e., preliminary simulations prior to crash testing), the pole configurations were simulated under MASH Test Nos. 3-60, 3-61, and 3-62 conditions at impact angles of 0 and 25 degrees and impacting the left-quarter, center, and right-quarter points of the vehicle. For efficiency purposes, the pole
Table 33. Updated list of pole configurations for rerunning LS-DYNA simulations.
| Sim. No. | Pole Height (ft) | Mast Arm Length (ft) | Mast Config. | Thickness (in.) | Pole Weight (lb) | Arm and Connection (lb) | Mass at Ends (lb) | Weight (lb) | CG Height (ft) |
|---|---|---|---|---|---|---|---|---|---|
| 1-11ga | 20 | 4 | S | 0.1196 | 143.2 | 40.6 | 75 | 259 | 12.01 |
| 54-11ga | 20 | 4 | D | 0.1196 | 143.2 | 81.2 | 150 | 374 | 14.60 |
| 6-11ga | 20 | 15 | S | 0.1196 | 143.2 | 86.8 | 75 | 305 | 13.79 |
| 59-11ga | 20 | 15 | D | 0.1196 | 143.2 | 173.6 | 150 | 467 | 16.73 |
| 19-11ga | 30 | 4 | S | 0.1196 | 225.4 | 40.6 | 75 | 341 | 16.66 |
| 72-11ga | 30 | 4 | D | 0.1196 | 225.4 | 81.2 | 150 | 457 | 20.00 |
| 24-11ga | 30 | 15 | S | 0.1196 | 225.4 | 86.8 | 75 | 387 | 18.67 |
| 77-11ga | 30 | 15 | D | 0.1196 | 225.4 | 173.6 | 150 | 549 | 22.30 |
| 78-11ga | 30 | 20 | S | 0.1196 | 225.4 | 152.0 | 75 | 452 | 20.60 |
| 79-11ga | 30 | 20 | D | 0.1196 | 225.4 | 303.0 | 150 | 678 | 24.60 |
| 19-7ga | 30 | 4 | S | 0.1880 | 354.3 | 40.6 | 75 | 470 | 16.20 |
| 72-7ga | 30 | 4 | D | 0.1880 | 354.3 | 81.2 | 150 | 586 | 18.98 |
| 24-7ga | 30 | 15 | S | 0.1880 | 354.3 | 86.8 | 75 | 516 | 17.82 |
| 77-7ga | 30 | 15 | D | 0.1880 | 354.3 | 173.6 | 150 | 678 | 21.21 |
| 27-7ga | 30 | 30 | S | 0.1880 | 500.0 | 212.0 | 75 | 787 | 24.30 |
| 35-11ga | 40 | 4 | S | 0.1196 | 367.4 | 40.6 | 75 | 483 | 21.23 |
| 88-11ga | 40 | 4 | D | 0.1196 | 367.4 | 81.2 | 150 | 599 | 24.85 |
| 40-11ga | 40 | 15 | S | 0.1196 | 367.4 | 86.8 | 75 | 529 | 23.21 |
| 93-11ga | 40 | 15 | D | 0.1196 | 367.4 | 173.6 | 150 | 691 | 27.56 |
| 41-11ga | 40 | 20 | S | 0.1196 | 367.4 | 151.5 | 75 | 594 | 25.29 |
| 94-11ga | 40 | 20 | D | 0.1196 | 367.4 | 303.0 | 150 | 820 | 30.04 |
| 35-7ga | 40 | 4 | S | 0.1880 | 578.0 | 40.6 | 75 | 694 | 20.59 |
| 88-7ga | 40 | 4 | D | 0.1880 | 578.0 | 81.2 | 150 | 809 | 23.43 |
| 40-7ga | 40 | 15 | S | 0.1880 | 578.0 | 86.8 | 75 | 740 | 22.10 |
| 93-7ga | 40 | 15 | D | 0.1880 | 578.0 | 173.6 | 150 | 902 | 25.69 |
| 41-7ga | 40 | 20 | S | 0.1880 | 578.0 | 151.5 | 75 | 804 | 23.78 |
| 94-7ga | 40 | 20 | D | 0.1880 | 578.0 | 303.0 | 150 | 1031 | 27.94 |
| 48-10ga | 50 | 4 | S | 0.1345 | 467.0 | 40.6 | 75 | 583 | 24.81 |
| 101-10ga | 50 | 4 | D | 0.1345 | 467.0 | 81.2 | 150 | 698 | 28.92 |
| 53-10ga | 50 | 15 | S | 0.1345 | 467.0 | 86.8 | 75 | 629 | 26.94 |
| 106-10ga | 50 | 15 | D | 0.1345 | 467.0 | 173.6 | 150 | 791 | 31.96 |
| 48-7ga | 50 | 4 | S | 0.1880 | 652.1 | 40.6 | 75 | 768 | 24.19 |
| 101-7ga | 50 | 4 | D | 0.1880 | 652.1 | 81.2 | 150 | 883 | 27.57 |
| 53-7ga | 50 | 15 | S | 0.1880 | 652.1 | 86.8 | 75 | 814 | 25.91 |
| 106-7ga | 50 | 15 | D | 0.1880 | 652.1 | 173.6 | 150 | 976 | 30.19 |
| 48-3ga | 50 | 4 | S | 0.2500 | 867.3 | 40.6 | 75 | 983 | 23.75 |
| 101-3ga | 50 | 4 | D | 0.2500 | 867.3 | 81.2 | 150 | 1099 | 26.54 |
| 53-3ga | 50 | 15 | S | 0.2500 | 867.3 | 86.8 | 75 | 1029 | 25.15 |
| 106-3ga | 50 | 15 | D | 0.2500 | 867.3 | 173.6 | 150 | 1191 | 28.80 |
Notes: S = single mast arm; D = dual mast arms.
configurations with maximum wall thicknesses and thus higher weights were exclusively simulated under critical impact conditions (i.e., vehicle center impact point and 0-degree impact angle for MASH 3-60, MASH 3-61, and MASH 3-62 impact conditions). For instance, the 50-ft-tall poles (i.e., pole Case Nos. 48, 101, 53, and 106) with 10-gauge pole wall thickness were simulated across all 18 MASH impact conditions, while other wall thicknesses, such as 7 and 3 gauge (which are less common), were exclusively simulated for the critical conditions.
Recall that the orientations are such that an impacting vehicle would be leaving the roadway and impacting the luminaire support located on the left side of the road. In other words, the left-quarter point corresponds to the nearest point to the pole, and the right-quarter point corresponds to the farthest point to the pole. Moreover, in the simulations, a 75-lb mass was added to the end of the mast arm to simulate the luminaire weight. In accordance with the project panel’s suggestion, as the numerical effort continues (in the continuation of the current project), the 75-lb mass will be modified to 50 lb. However, in comparison with the results obtained from the previous simulations, the simulations maintained the 75-lb mass.
The simulations for the pole configurations were post-processed, and their results were analyzed to identify possible trends regarding the MASH safety criteria, including occupant compartment deformation, occupant risk measures (i.e., lateral and longitudinal OIV and ORA) and vehicle instability (i.e., roll and pitch angles).
Occupant Compartment Deformation
A summary of the simulated maximum occupant compartment deformation for MASH 3-60 is shown in Table 34. For the MASH 3-61 and MASH 3-62 impacts, the simulated maximum occupant compartment deformation is shown in Table 35. The “N/A” designation indicates that the pole did not contact any part of the vehicle. The letters “W,” “A,” “B,” and “C” appearing in front the values indicate the specific area of the vehicle where the maximum deformation occurred. As such, “W” stands for the windshield area, “A” denotes A-pillar, and “B” and “C” stand for B-pillar and C-pillar, respectively. The “NB” designation denotes that the transformer base did not break away, thus no pole–vehicle contact was expected.
In these tables, the expected potential to pass the MASH safety criteria for each pole configuration is shown. A cell that indicates a medium potential to pass the MASH criteria means that at least one measure of the safety criteria exceeded the preferred limit in MASH or resulted in a concerning value if no preferred limit exists. For occupant compartment deformation, any deformation due to the luminaire pole contacting the vehicle’s roof was considered to have medium potential to pass MASH criteria due to the high variability of luminaire pole behavior. This conservative approach was taken due to the current uncertainty in the models’ accuracy in predicting vehicle deformation. If the deformation exceeded the MASH limit of 4 in., the cell was highlighted, indicating low potential of passing MASH. Note that the blank cells (where no values are present) indicate that a simulation was not conducted for that specific impact condition and does not imply a high likelihood of passing MASH.
Several trends were identified from analysis of the simulation results in terms of occupant compartment deformation (generally referred to as roof crush, windshield crush, or rear window crush). Similar to the first round of simulation in Phase II, the simulation results (using the revised base model after full-scale crash tests) proved that MASH Test No. 3-60 tended to be more critical than Test Nos. 3-61 and 3-62 due to the larger roof crush observed when the luminaire pole fell on top of the vehicle moving at a low speed.
For the majority of cases, center impacts were identified as more critical than right- or left-quarter point impacts in terms of roof crush. This finding was due to the propensity for the pole to fall longitudinally and land directly on the vehicle instead of being pushed to the side of the
Table 34. Updated simulation results for pole configurations – maximum occupant compartment deformation (in.), MASH 3-60.
| Sim. No. | Pole Height (ft) | Mast Arm Length (ft) | Mast Config. | Thickness (in.) | Pole Weight (lb) | Arm and Connection (lb) | Mass at Ends (lb) | Weight (lb) | CG Height (ft) | MASH 3-60 | |||||
|---|---|---|---|---|---|---|---|---|---|---|---|---|---|---|---|
| Left 1/4 | Center | Right 1/4 | |||||||||||||
| 0 | 25 | 0 | 25 | 0 | 25 | ||||||||||
| 1-11ga | 20 | 4 | S | 0.1196 | 143.2 | 40.6 | 75 | 259 | 12.01 | 0.9 (C) | 1.4 | 1.3 (W) | 0.4 (A) | 0.6 (A) | 0.4 (A) |
| 54-11ga | 20 | 4 | D | 0.1196 | 143.2 | 81.2 | 150 | 374 | 14.60 | 1.1 (C) | 1.0 (C) | 2.6 | 6.7 | N/A | N/A |
| 6-11ga | 20 | 15 | S | 0.1196 | 143.2 | 86.8 | 75 | 305 | 13.79 | N/A | 0.3 (B) | 1.16 | 1.52 (A) | 0.6 (A) | 0.3 (A) |
| 59-11ga | 20 | 15 | D | 0.1196 | 143.2 | 173.6 | 150 | 467 | 16.73 | 0.9 (C) | N/A | 3.38 | 1.7 (A) | 0.6 (A) | 0.4 (A) |
| 19-11ga | 30 | 4 | S | 0.1196 | 225.4 | 40.6 | 75 | 341 | 16.66 | N/A | N/A | 0.7 (W) | N/A | N/A | N/A |
| 72-11ga | 30 | 4 | D | 0.1196 | 225.4 | 81.2 | 150 | 457 | 20.00 | N/A | N/A | 1.85 | N/A | N/A | N/A |
| 24-11ga | 30 | 15 | S | 0.1196 | 225.4 | 86.8 | 75 | 387 | 18.67 | N/A | 1.18 (C) | 3.08 | N/A | N/A | N/A |
| 77-11ga | 30 | 15 | D | 0.1196 | 225.4 | 173.6 | 150 | 549 | 22.30 | N/A | N/A | 2.76 | 0.73 (C) | N/A | N/A |
| 78-11ga | 30 | 20 | S | 0.1196 | 225.4 | 152.0 | 75 | 452 | 20.60 | N/A | N/A | 2.3 | N/A | N/A | N/A |
| 79-11ga | 30 | 20 | D | 0.1196 | 225.4 | 303.0 | 150 | 678 | 24.60 | N/A | 0.2 (A) | 2.53 | 1.15 (C) | N/A | N/A |
| 19-7ga | 30 | 4 | S | 0.1880 | 354.3 | 40.6 | 75 | 470 | 16.20 | N/A | N/A | 3.41 | 1.26 (A) | N/A | N/A |
| 72-7ga | 30 | 4 | D | 0.1880 | 354.3 | 81.2 | 150 | 586 | 18.98 | 5.54 | 6.96 | ||||
| 24-7ga | 30 | 15 | S | 0.1880 | 354.3 | 86.8 | 75 | 516 | 17.82 | 3.11 | 0 | ||||
| 77-7ga | 30 | 15 | D | 0.1880 | 354.3 | 173.6 | 150 | 678 | 21.21 | 5.64 | 1.37 | ||||
| 27-7ga | 30 | 30 | S | 0.1880 | 500.0 | 212.0 | 75 | 787 | 24.30 | NB | NB | NB | NB | NB | NB |
| 35-11ga | 40 | 4 | S | 0.1196 | 367.4 | 40.6 | 75 | 483 | 21.23 | N/A | 0.57 (C) | 3.86 | 0.90 | N/A | N/A |
| 88-11ga | 40 | 4 | D | 0.1196 | 367.4 | 81.2 | 150 | 599 | 24.85 | N/A | 2.2 | 4.45 | 2.23 | N/A | N/A |
| 40-11ga | 40 | 15 | S | 0.1196 | 367.4 | 86.8 | 75 | 529 | 23.21 | N/A | 1.94 (C) | 3.68 | 5.03 | N/A | N/A |
| 93-11ga | 40 | 15 | D | 0.1196 | 367.4 | 173.6 | 150 | 691 | 27.56 | N/A | N/A | 3.44 | 1.86 (C) | N/A | N/A |
| 41-11ga | 40 | 20 | S | 0.1196 | 367.4 | 151.5 | 75 | 594 | 25.29 | N/A | 1.68 (C) | 1.71 | 4.82 | N/A | N/A |
| 94-11ga | 40 | 20 | D | 0.1196 | 367.4 | 303.0 | 150 | 820 | 30.04 | N/A | N/A | 1.68 | 1.88 | N/A | N/A |
| 35-7ga | 40 | 4 | S | 0.1880 | 578.0 | 40.6 | 75 | 694 | 20.59 | N/A | N/A | 5.4 | 3.47 | N/A | N/A |
| 88-7ga | 40 | 4 | D | 0.1880 | 578.0 | 81.2 | 150 | 809 | 23.43 | 7.11 | 3.26 | ||||
| 40-7ga | 40 | 15 | S | 0.1880 | 578.0 | 86.8 | 75 | 740 | 22.10 | 6.5 | 6.2 | ||||
| 93-7ga | 40 | 15 | D | 0.1880 | 578.0 | 173.6 | 150 | 902 | 25.69 | 3.27 | N/A | ||||
| 41-7ga | 40 | 20 | S | 0.1880 | 578.0 | 151.5 | 75 | 804 | 23.78 | 1.96 | 2.65 | ||||
| 94-7ga | 40 | 20 | D | 0.1880 | 578.0 | 303.0 | 150 | 1031 | 27.94 | N/A | N/A | 3.31 | 0.9 (C) | N/A | N/A |
| 48-10ga | 50 | 4 | S | 0.1345 | 467.0 | 40.6 | 75 | 583 | 24.81 | NB | NB | 0.94 (W) | 5.12 | N/A | NB |
| 101-10ga | 50 | 4 | D | 0.1345 | 467.0 | 81.2 | 150 | 698 | 28.92 | N/A | NB | 8.11 | 1.5 (C) | N/A | NB |
| 53-10ga | 50 | 15 | S | 0.1345 | 467.0 | 86.8 | 75 | 629 | 26.94 | N/A | NB | 4.2 | 0.6 (C) | N/A | NB |
| 106-10ga | 50 | 15 | D | 0.1345 | 467.0 | 173.6 | 150 | 791 | 31.96 | N/A | NB | 4.81 | 2 | N/A | NB |
| 48-7ga | 50 | 4 | S | 0.1880 | 652.1 | 40.6 | 75 | 768 | 24.19 | NB | NB | 0.4 (A) | 7.28 | N/A | NB |
| 101-7ga | 50 | 4 | D | 0.1880 | 652.1 | 81.2 | 150 | 883 | 27.57 | 6.35 | 1.42 (C) | ||||
| 53-7ga | 50 | 15 | S | 0.1880 | 652.1 | 86.8 | 75 | 814 | 25.91 | 4.66 | 3.05 | ||||
| 106-7ga | 50 | 15 | D | 0.1880 | 652.1 | 173.6 | 150 | 976 | 30.19 | N/A | NB | 0.75 (C) | 0.87 (C) | NB | NB |
| 48-3ga | 50 | 4 | S | 0.2500 | 867.3 | 40.6 | 75 | 983 | 23.75 | NB | NB | 7.90 | 9.50 | N/A | NB |
| 101-3ga | 50 | 4 | D | 0.2500 | 867.3 | 81.2 | 150 | 1099 | 26.54 | 9.25 | 8.80 | ||||
| 53-3ga | 50 | 15 | S | 0.2500 | 867.3 | 86.8 | 75 | 1029 | 25.15 | 3.98 | N/A | ||||
| 106-3ga | 50 | 15 | D | 0.2500 | 867.3 | 173.6 | 150 | 1191 | 28.80 | NB | NB | 8.30 | 6.75 | NB | NB |
Notes: ![]() = low potential to pass MASH (deformation > 4.0 in.);
= low potential to pass MASH (deformation > 4.0 in.); ![]() = medium potential to pass MASH (0.0 in. < deformation ≤ 4.0 in.); “A,” “B,” “C,” and “W” stand for A-pillar, B-pillar, C-pillar, and windshield deformation; S = single mast arm; D = dual mast arms; “NB” denotes that the transformer base did not break away; “N/A” indicates that pole did not contact any part of vehicle; blank cells indicate that no simulation was conducted.
= medium potential to pass MASH (0.0 in. < deformation ≤ 4.0 in.); “A,” “B,” “C,” and “W” stand for A-pillar, B-pillar, C-pillar, and windshield deformation; S = single mast arm; D = dual mast arms; “NB” denotes that the transformer base did not break away; “N/A” indicates that pole did not contact any part of vehicle; blank cells indicate that no simulation was conducted.
Table 35. Updated simulation results for pole configurations – maximum occupant compartment deformation (in.), MASH 3-61 and MASH 3-62.
| Sim. No. | Pole Height (ft) | Mast Arm Length (ft) | Mast Config. | Thickness (in.) | Pole Weight (lb) | Arm and Connection (lb) | Mass at Ends (lb) | Weight (lb) | CG Height (ft) | MASH 3-61 | MASH 3-62 | ||||||||||
|---|---|---|---|---|---|---|---|---|---|---|---|---|---|---|---|---|---|---|---|---|---|
| Left 1/4 | Center | Right 1/4 | Left 1/4 | Center | Right 1/4 | ||||||||||||||||
| 0 | 25 | 0 | 25 | 0 | 25 | 0 | 25 | 0 | 25 | 0 | 25 | ||||||||||
| 1-11ga | 20 | 4 | S | 0.1196 | 143.2 | 40.6 | 75 | 259 | 12.01 | N/A | N/A | N/A | N/A | N/A | N/A | N/A | N/A | N/A | N/A | N/A | N/A |
| 54-11ga | 20 | 4 | D | 0.1196 | 143.2 | 81.2 | 150 | 374 | 14.60 | N/A | N/A | N/A | N/A | N/A | N/A | N/A | N/A | N/A | N/A | N/A | N/A |
| 6-11ga | 20 | 15 | S | 0.1196 | 143.2 | 86.8 | 75 | 305 | 13.79 | N/A | N/A | N/A | N/A | N/A | N/A | N/A | N/A | N/A | N/A | N/A | N/A |
| 59-11ga | 20 | 15 | D | 0.1196 | 143.2 | 173.6 | 150 | 467 | 16.73 | N/A | N/A | N/A | N/A | N/A | N/A | N/A | N/A | N/A | N/A | N/A | N/A |
| 19-11ga | 30 | 4 | S | 0.1196 | 225.4 | 40.6 | 75 | 341 | 16.66 | N/A | N/A | N/A | N/A | N/A | N/A | N/A | N/A | N/A | N/A | N/A | N/A |
| 72-11ga | 30 | 4 | D | 0.1196 | 225.4 | 81.2 | 150 | 457 | 20.00 | N/A | N/A | N/A | N/A | N/A | N/A | N/A | N/A | N/A | N/A | N/A | N/A |
| 24-11ga | 30 | 15 | S | 0.1196 | 225.4 | 86.8 | 75 | 387 | 18.67 | N/A | N/A | N/A | N/A | N/A | N/A | N/A | N/A | N/A | N/A | N/A | N/A |
| 77-11ga | 30 | 15 | D | 0.1196 | 225.4 | 173.6 | 150 | 549 | 22.30 | N/A | N/A | N/A | N/A | N/A | N/A | N/A | N/A | N/A | N/A | N/A | N/A |
| 78-11ga | 30 | 20 | S | 0.1196 | 225.4 | 152.0 | 75 | 452 | 20.60 | N/A | N/A | N/A | N/A | N/A | N/A | N/A | N/A | N/A | N/A | N/A | N/A |
| 79-11ga | 30 | 20 | D | 0.1196 | 225.4 | 303.0 | 150 | 678 | 24.60 | N/A | N/A | N/A | N/A | N/A | N/A | N/A | N/A | N/A | N/A | N/A | N/A |
| 19-7ga | 30 | 4 | S | 0.1880 | 354.3 | 40.6 | 75 | 470 | 16.20 | N/A | N/A | N/A | N/A | ||||||||
| 72-7ga | 30 | 4 | D | 0.1880 | 354.3 | 81.2 | 150 | 586 | 18.98 | N/A | N/A | N/A | N/A | ||||||||
| 24-7ga | 30 | 15 | S | 0.1880 | 354.3 | 86.8 | 75 | 516 | 17.82 | N/A | N/A | N/A | N/A | ||||||||
| 77-7ga | 30 | 15 | D | 0.1880 | 354.3 | 173.6 | 150 | 678 | 21.21 | N/A | N/A | N/A | N/A | ||||||||
| 27-7ga | 30 | 30 | S | 0.1880 | 500.0 | 212.0 | 75 | 787 | 24.30 | N/A | N/A | N/A | N/A | ||||||||
| 35-11ga | 40 | 4 | S | 0.1196 | 367.4 | 40.6 | 75 | 483 | 21.23 | N/A | N/A | N/A | N/A | N/A | N/A | N/A | N/A | N/A | N/A | N/A | N/A |
| 88-11ga | 40 | 4 | D | 0.1196 | 367.4 | 81.2 | 150 | 599 | 24.85 | N/A | N/A | N/A | N/A | N/A | N/A | N/A | N/A | N/A | N/A | N/A | N/A |
| 40-11ga | 40 | 15 | S | 0.1196 | 367.4 | 86.8 | 75 | 529 | 23.21 | N/A | N/A | N/A | N/A | N/A | N/A | N/A | N/A | N/A | N/A | N/A | N/A |
| 93-11ga | 40 | 15 | D | 0.1196 | 367.4 | 173.6 | 150 | 691 | 27.56 | N/A | N/A | N/A | N/A | N/A | N/A | N/A | N/A | N/A | N/A | N/A | N/A |
| 41-11ga | 40 | 20 | S | 0.1196 | 367.4 | 151.5 | 75 | 594 | 25.29 | N/A | N/A | N/A | N/A | N/A | N/A | N/A | N/A | N/A | N/A | N/A | N/A |
| 94-11ga | 40 | 20 | D | 0.1196 | 367.4 | 303.0 | 150 | 820 | 30.04 | N/A | N/A | N/A | N/A | N/A | N/A | N/A | N/A | N/A | N/A | N/A | N/A |
| 35-7ga | 40 | 4 | S | 0.1880 | 578.0 | 40.6 | 75 | 694 | 20.59 | N/A | N/A | N/A | N/A | ||||||||
| 88-7ga | 40 | 4 | D | 0.1880 | 578.0 | 81.2 | 150 | 809 | 23.43 | N/A | N/A | N/A | N/A | ||||||||
| 40-7ga | 40 | 15 | S | 0.1880 | 578.0 | 86.8 | 75 | 740 | 22.10 | N/A | N/A | N/A | N/A | ||||||||
| 93-7ga | 40 | 15 | D | 0.1880 | 578.0 | 173.6 | 150 | 902 | 25.69 | N/A | N/A | N/A | N/A | ||||||||
| 41-7ga | 40 | 20 | S | 0.1880 | 578.0 | 151.5 | 75 | 804 | 23.78 | N/A | N/A | N/A | N/A | ||||||||
| 94-7ga | 40 | 20 | D | 0.1880 | 578.0 | 303.0 | 150 | 1031 | 27.94 | N/A | N/A | N/A | N/A | ||||||||
| 48-10ga | 50 | 4 | S | 0.1345 | 467.0 | 40.6 | 75 | 583 | 24.81 | N/A | N/A | N/A | N/A | N/A | N/A | N/A | N/A | N/A | N/A | N/A | N/A |
| 101-10ga | 50 | 4 | D | 0.1345 | 467.0 | 81.2 | 150 | 698 | 28.92 | N/A | N/A | N/A | N/A | N/A | N/A | N/A | N/A | N/A | N/A | N/A | N/A |
| 53-10ga | 50 | 15 | S | 0.1345 | 467.0 | 86.8 | 75 | 629 | 26.94 | N/A | N/A | N/A | N/A | N/A | N/A | N/A | N/A | N/A | N/A | N/A | N/A |
| 106-10ga | 50 | 15 | D | 0.1345 | 467.0 | 173.6 | 150 | 791 | 31.96 | N/A | N/A | N/A | N/A | N/A | N/A | N/A | N/A | N/A | N/A | N/A | N/A |
| 48-7ga | 50 | 4 | S | 0.1880 | 652.1 | 40.6 | 75 | 768 | 24.19 | N/A | N/A | N/A | N/A | ||||||||
| 101-7ga | 50 | 4 | D | 0.1880 | 652.1 | 81.2 | 150 | 883 | 27.57 | N/A | N/A | N/A | N/A | ||||||||
| 53-7ga | 50 | 15 | S | 0.1880 | 652.1 | 86.8 | 75 | 814 | 25.91 | N/A | N/A | N/A | N/A | ||||||||
| 106-7ga | 50 | 15 | D | 0.1880 | 652.1 | 173.6 | 150 | 976 | 30.19 | N/A | N/A | N/A | N/A | ||||||||
| 48-3ga | 50 | 4 | S | 0.2500 | 867.3 | 40.6 | 75 | 983 | 23.75 | N/A | N/A | N/A | N/A | ||||||||
| 101-3ga | 50 | 4 | D | 0.2500 | 867.3 | 81.2 | 150 | 1099 | 26.54 | N/A | N/A | N/A | N/A | ||||||||
| 53-3ga | 50 | 15 | S | 0.2500 | 867.3 | 86.8 | 75 | 1029 | 25.15 | N/A | N/A | N/A | N/A | ||||||||
| 106-3ga | 50 | 15 | D | 0.2500 | 867.3 | 173.6 | 150 | 1191 | 28.80 | N/A | N/A | N/A | N/A | ||||||||
Notes: S = single mast arm; D = dual mast arms; “N/A” indicates that pole did not contact any part of vehicle; blank cells indicate that no simulation was conducted.
vehicle during quarter-point impacts. The center of the vehicle’s roof also tended to be less stiff as compared to the roof sides, which resulted in larger roof deformations under pole impacts. While there were instances where a 25-degree impact angle resulted in increased roof crush as compared to 0-degree impact angle (e.g., Case Nos. 54-11ga, 72-7ga, 40-11ga, 41-11ga, 48-10ga), the general trend indicated that a center impact point was more likely to lead to pole contact with the center of the roof, thereby causing higher roof crush.
In the case of one particular outlier, namely Case No. 54-11ga (involving a 20-ft-tall pole with dual 4-ft-long mast arms), the MASH 3-60 impact with a center impact point at a 25-degree impact angle showed significantly higher roof crush (6.7 in.) compared to the 0-degree impact scenario (2.6 in.). This finding may be attributed to uncertainties associated with the nature of base fracture. In the 25-degree impact, the pole made contact with the center of the vehicle roof, as shown in Figure 151. While acknowledging that such behavior may be a rare occurrence in physical crash tests, the general trend still proves that a 0-degree impact with a center impact

point tended to result in more substantial roof crush, recommending this impact scenario for evaluating roof crush.
For a better comparison, the simulated roof crush data were ordered based on the total system weight, as shown in Table 36. Excluding the outlier Case 54-11ga (center impact point with a 25-degree impact angle), this showed that the simulated roof crush raises concerns for poles weighing more than 500 lb.
In Test Nos. 3-61 and 3-62, the vehicle travels at a higher speed and passes underneath the pole before the pole impacts the vehicle’s roof. No occurrences were observed in MASH 3-61 and 3-62 impacts that would suggest a scenario in which the pole would come into contact with a high-speed vehicle. As of the present, no full-scale crash tests have been conducted under the MASH 3-61 and 3-62 impact conditions, and the LS-DYNA simulations involving high-speed scenarios have not been validated through these tests. Thus, there is a clear future need to include MASH 3-61 and MASH 3-62 impact conditions in the testing and validation process.
The simulation results showed that in low-speed impacts (e.g., 19 mph), there is a high likelihood of the pole making contact with the small car (1100C vehicle). In high-speed impacts, (e.g., 62 mph), the pole tends to pass over the vehicle without contact. As a follow-up, additional simulations were conducted with impact speeds ranging from 19 to 62 mph to determine the impact speed at which the pole would not contact the car. Similarly, additional simulations were conducted with a 2270P pickup truck with impact speeds below 62 mph. These simulations were conducted to find the maximum speed (below 62 mph) at which pole contact with the truck was initiated, which would raise concerns about potential roof crush issues. Two luminaire poles with 20-ft and 50-ft heights were investigated, as shown in Table 37.
In the case of shorter poles (20 ft in height), simulations indicated that the average speed at which the pole made contact with either small cars or pickup trucks was around 30 mph. For taller poles (50 ft in height), the simulations suggest that the average speed at which contact with vehicles occurred was approximately 40 mph.
Longitudinal OIV
A summary of the simulated longitudinal OIV for MASH 3-60, 3-61, and 3-62 is shown in Table 38. The empty cells indicate that simulations for those specific impact conditions were not conducted for the given pole configurations. Also, for a better comparison, the simulated roof crush data were ordered based on the total system weight, as shown in Table 39. Several trends were identified from the analysis of the simulation results in terms of OIV. First, all OIV values increased from the initial simulations (conducted before full-scale crash testing) as the base model was revised with thicker corner walls and added gussets at the top.
In all MASH 3-60, 3-61, and 3-62 impacts, there was a noticeable trend of increasing OIV values as the total system weight increased. The MASH 3-62 impacts showed the least concerning OIVs, with all values falling below the MASH limit of 16 ft/s. For MASH 3-61 and MASH 3-62 impacts with a vehicle center impact point and 0-degree impact angle, the OIVs versus pole total weight are shown in Figure 152. The general trend was increased OIV by weight. Moreover, all OIV values for MASH 3-62 were lower than the OIV values associated with MASH 3-61 and MASH 3-60 impacts. As a result, if the impacts with pickup trucks (MASH 3-62 impacts) are successfully validated through future full-scale crash testing, it may eliminate the need for conducting MASH 3-62 full-scale crash tests on any pole configuration. Based on simulation results, if a pole passes the OIV criteria in MASH 3-61 impacts, it is highly likely to also meet the OIV requirements for MASH 3-62 impacts.
Table 36. Updated simulation results for pole configurations – maximum occupant compartment deformation (in.), MASH 3-60 ranked based on total system weight.
| Sim. No. | Pole Height (ft) | Mast Arm Length (ft) | Mast Config. | Thickness (in.) | Pole Weight (lb) | Arm and Connection (lb) | Mass at Ends (lb) | Weight (lb) | CG Height (ft) | MASH 3-60 | |||||
|---|---|---|---|---|---|---|---|---|---|---|---|---|---|---|---|
| Left 1/4 | Center | Right 1/4 | |||||||||||||
| 0 | 25 | 0 | 25 | 0 | 25 | ||||||||||
| 1-11ga | 20 | 4 | S | 0.1196 | 143.2 | 40.6 | 75 | 259 | 12.01 | 0.9 (C) | 1.4 | 1.3 (W) | 0.4 (A) | 0.6 (A) | 0.4 (A) |
| 6-11ga | 20 | 15 | S | 0.1196 | 143.2 | 86.8 | 75 | 305 | 13.79 | N/A | 0.3 (B) | 1.16 | 1.52 (A) | 0.6 (A) | 0.3 (A) |
| 19-11ga | 30 | 4 | S | 0.1196 | 225.4 | 40.6 | 75 | 341 | 16.66 | N/A | N/A | 0.7 (W) | N/A | N/A | N/A |
| 54-11ga | 20 | 4 | D | 0.1196 | 143.2 | 81.2 | 150 | 374 | 14.60 | 1.1 (C) | 1.0 (C) | 2.6 | 6.7 | N/A | N/A |
| 24-11ga | 30 | 15 | S | 0.1196 | 225.4 | 86.8 | 75 | 387 | 18.67 | N/A | 1.18 (C) | 3.08 | N/A | N/A | N/A |
| 78-11ga | 30 | 20 | S | 0.1196 | 225.4 | 152.0 | 75 | 452 | 20.60 | N/A | N/A | 2.3 | N/A | N/A | N/A |
| 72-11ga | 30 | 4 | D | 0.1196 | 225.4 | 81.2 | 150 | 457 | 20.00 | N/A | N/A | 1.85 | N/A | N/A | N/A |
| 59-11ga | 20 | 15 | D | 0.1196 | 143.2 | 173.6 | 150 | 467 | 16.73 | 0.9 (C) | N/A | 3.38 | 1.7 (A) | 0.6 (A) | 0.4 (A) |
| 19-7ga | 30 | 4 | S | 0.1880 | 354.3 | 40.6 | 75 | 470 | 16.20 | N/A | N/A | 3.41 | 1.26 (A) | N/A | N/A |
| 35-11ga | 40 | 4 | S | 0.1196 | 367.4 | 40.6 | 75 | 483 | 21.23 | N/A | 0.57 (C) | 3.86 | 0.90 | N/A | N/A |
| 24-7ga | 30 | 15 | S | 0.1880 | 354.3 | 86.8 | 75 | 516 | 17.82 | 3.11 | 0 | ||||
| 40-11ga | 40 | 15 | S | 0.1196 | 367.4 | 86.8 | 75 | 529 | 23.21 | N/A | 1.94 (C) | 3.68 | 5.03 | N/A | N/A |
| 77-11ga | 30 | 15 | D | 0.1196 | 225.4 | 173.6 | 150 | 549 | 22.30 | N/A | N/A | 2.76 | 0.73 (C) | N/A | N/A |
| 48-10ga | 50 | 4 | S | 0.1345 | 467.0 | 40.6 | 75 | 583 | 24.81 | NB | NB | 0.94 (W) | 5.12 | N/A | NB |
| 72-7ga | 30 | 4 | D | 0.1880 | 354.3 | 81.2 | 150 | 586 | 18.98 | 5.54 | 6.96 | ||||
| 41-11ga | 40 | 20 | S | 0.1196 | 367.4 | 151.5 | 75 | 594 | 25.29 | N/A | 1.68 (C) | 1.71 | 4.82 | N/A | N/A |
| 88-11ga | 40 | 4 | D | 0.1196 | 367.4 | 81.2 | 150 | 599 | 24.85 | N/A | 2.2 | 4.45 | 2.23 | N/A | N/A |
| 53-10ga | 50 | 15 | S | 0.1345 | 467.0 | 86.8 | 75 | 629 | 26.94 | N/A | NB | 4.2 | 0.6 (C) | N/A | NB |
| 77-7ga | 30 | 15 | D | 0.1880 | 354.3 | 173.6 | 150 | 678 | 21.21 | 5.64 | 1.37 | ||||
| 79-11ga | 30 | 20 | D | 0.1196 | 225.4 | 303.0 | 150 | 678 | 24.60 | N/A | 0.2 (A) | 2.53 | 1.15 (C) | N/A | N/A |
| 93-11ga | 40 | 15 | D | 0.1196 | 367.4 | 173.6 | 150 | 691 | 27.56 | N/A | N/A | 3.44 | 1.86 (C) | N/A | N/A |
| 35-7ga | 40 | 4 | S | 0.1880 | 578.0 | 40.6 | 75 | 694 | 20.59 | N/A | N/A | 5.4 | 3.47 | N/A | N/A |
| 101-10ga | 50 | 4 | D | 0.1345 | 467.0 | 81.2 | 150 | 698 | 28.92 | N/A | NB | 8.11 | 1.5 (C) | N/A | NB |
| 40-7ga | 40 | 15 | S | 0.1880 | 578.0 | 86.8 | 75 | 740 | 22.10 | 6.5 | 6.2 | ||||
| 48-7ga | 50 | 4 | S | 0.1880 | 652.1 | 40.6 | 75 | 768 | 24.19 | NB | NB | 0.4 (A) | 7.28 | N/A | NB |
| 106-10ga | 50 | 15 | D | 0.1345 | 467.0 | 173.6 | 150 | 791 | 31.96 | N/A | NB | 4.81 | 2 | N/A | NB |
| 41-7ga | 40 | 20 | S | 0.1880 | 578.0 | 151.5 | 75 | 804 | 23.78 | 1.96 | 2.65 | ||||
| 88-7ga | 40 | 4 | D | 0.1880 | 578.0 | 81.2 | 150 | 809 | 23.43 | 7.11 | 3.26 | ||||
| 53-7ga | 50 | 15 | S | 0.1880 | 652.1 | 86.8 | 75 | 814 | 25.91 | 4.66 | 3.05 | ||||
| 94-11ga | 40 | 20 | D | 0.1196 | 367.4 | 303.0 | 150 | 820 | 30.04 | N/A | N/A | 1.68 | 1.88 | N/A | N/A |
| 101-7ga | 50 | 4 | D | 0.1880 | 652.1 | 81.2 | 150 | 883 | 27.57 | 6.35 | 1.42 (C) | ||||
| 93-7ga | 40 | 15 | D | 0.1880 | 578.0 | 173.6 | 150 | 902 | 25.69 | 3.27 | N/A | ||||
| 106-7ga | 50 | 15 | D | 0.1880 | 652.1 | 173.6 | 150 | 976 | 30.19 | N/A | NB | 0.75 (C) | 0.87 (C) | NB | NB |
| 48-3ga | 50 | 4 | S | 0.2500 | 867.3 | 40.6 | 75 | 983 | 23.75 | NB | NB | 7.90 | 9.50 | N/A | NB |
| 53-3ga | 50 | 15 | S | 0.2500 | 867.3 | 86.8 | 75 | 1029 | 25.15 | 3.98 | N/A | ||||
| 94-7ga | 40 | 20 | D | 0.1880 | 578.0 | 303.0 | 150 | 1031 | 27.94 | N/A | N/A | 3.31 | 0.9(C) | N/A | N/A |
| 101-3ga | 50 | 4 | D | 0.2500 | 867.3 | 81.2 | 150 | 1099 | 26.54 | 9.25 | 8.80 | ||||
| 106-3ga | 50 | 15 | D | 0.2500 | 867.3 | 173.6 | 150 | 1191 | 28.80 | NB | NB | 8.30 | 6.75 | NB | NB |
Notes: ![]() = low potential to pass MASH (deformation > 4.0 in.);
= low potential to pass MASH (deformation > 4.0 in.); ![]() = medium potential to pass MASH (0.0 in. < deformation ≤ 4.0 in.); “A,” “B,” “C,” and “W” stand for A-pillar, B-pillar, C-pillar, and windshield deformation; S = single mast arm; D = dual mast arms; “NB” denotes that the transformer base did not break away; “N/A” indicates that pole did not contact any part of vehicle; blank cells indicate that no simulation was conducted.
= medium potential to pass MASH (0.0 in. < deformation ≤ 4.0 in.); “A,” “B,” “C,” and “W” stand for A-pillar, B-pillar, C-pillar, and windshield deformation; S = single mast arm; D = dual mast arms; “NB” denotes that the transformer base did not break away; “N/A” indicates that pole did not contact any part of vehicle; blank cells indicate that no simulation was conducted.
Table 37. Additional LS-DYNA simulations with intermediate impact speeds.
| Pole Configuration | Vehicle | Low Speed (19 mph) |
High Speed (62 mph) |
Intermediate Speed |
|---|---|---|---|---|
| Case No. 54-11ga (20-ft-tall pole with dual 4-ft-long mast arms) | Small car | At 19 mph (MASH 3-60), pole impacted small car | At 62 mph (MASH 3-61), pole did not impact small car | At 31 mph, pole impacted small car |
| Case No. 54-11ga (20-ft-tall pole with dual 4-ft-long mast arms) | Pickup truck | N/A | At 62 mph (MASH 3-62), pole did not impact pickup truck | At 29 mph, pole impacted pickup truck |
| Case No. 101-7ga (50-ft-tall pole with dual 4-ft-long mast arms) | Small car | At 19 mph (MASH 3-60) pole impacted small car | At 62 mph (MASH 3-61), pole did not impact small car | At 42 mph, pole impacted small car |
| Case No. 101-7ga (50-ft-tall pole with dual 4-ft-long mast arms) | Pickup truck | N/A | At 62 mph (MASH 3-62), pole did not impact pickup truck | At 39 mph, pole impacted pickup truck |
N/A = Not required by MASH, so simulation was not conducted.
As shown in Figure 152, MASH 3-61 OIV values for a majority of tall and heavy poles exceeded the MASH limit. Thus, it is suggested that for tall-heavy poles, there is a need for full-scale crash testing for OIV evaluation.
In the case of MASH 3-61 impacts, the center impact point at a 0-degree angle showed OIV values that were either similar to or higher than those observed in other impact conditions, such as the 25-degree angle, left-quarter, and right-quarter impacts. As such, center impacts at 0-degrees can be considered a suitable representative for assessing OIV in various impact scenarios.
In several MASH 3-60 impact cases where the base did not break away (indicated as “NB” in Table 34), the OIV exceeded 21 ft/s. It is important to note that for left- or right-quarter impact points at a 25-degree angle, a distinct interaction pattern was observed. In these cases, the small car began to yaw and rotate around the base, preventing it from breaking away. However, in vehicle centered impacts, the front end effectively wrapped around the base, eventually causing the base to fracture.
There is currently no test with a 25-degree impact angle to validate this behavior (i.e., excessive OIV due to the vehicle yawing around the base and thus the base not breaking away smoothly). Therefore, as of now, no definitive conclusions can be drawn. In previous literature, there were pendulum tests that indicated the 0-degree impact angle to be more critical than the 25-degree angle in terms of breakaway behavior. However, the base design had several modifications, including the addition of gussets at the top and bottom of the base at the corners, as well as an increase in wall thickness at the corners. This historical change was undertaken to improve wind load stability. As there is no available data on the base behavior when impacted at 25 degrees after modifications to evaluate the effect of these changes, it is necessary to conduct full-scale crash tests with a 25-degree impact angle and vehicle left- or right-quarter impacts to investigate this behavior further. This behavior appeared in the new set of simulations with the modified base model. If such behavior is validated through full-scale crash testing, it would become necessary to run one full-scale crash test with this impact condition to assess the OIV criterion. Note that a 0-degree centered impact remains critical for assessing roof crush concerns.
The OIV concern associated with a 25-degree impact angle and left- or right-quarter impact point appears to be a consistent pattern across all pole configurations, ranging from 20 ft to 50 ft in height. To conclusively address this concern, conducting a single full-scale crash test under this specific impact condition is needed. Upon completion of this test, further guidelines regarding the necessity of such a crash test for assessing OIV for luminaire poles could be provided.
Table 38. Updated simulation results for pole configurations – longitudinal OIV (ft/s), MASH 3-60, MASH 3-61, and MASH 3-62.
| Sim. No. | Pole Height (ft) | Mast Arm Length (ft) | Mast Config. | Thickness (in.) | Pole Weight (lb) | Arm Connection (lb) | Mass at Ends (lb) | Weight (lb) | CG (ft) | MASH 3-60 | MASH 3-61 | MASH 3-62 | |||||||||||||||
|---|---|---|---|---|---|---|---|---|---|---|---|---|---|---|---|---|---|---|---|---|---|---|---|---|---|---|---|
| Left 1/4 | Center | Right 1/4 | Left 1/4 | Center | Right 1/4 | Left 1/4 | Center | Right 1/4 | |||||||||||||||||||
| 0 | 25 | 0 | 25 | 0 | 25 | 0 | 25 | 0 | 25 | 0 | 25 | 0 | 25 | 0 | 25 | 0 | 25 | ||||||||||
| 1-11ga | 20 | 4 | S | 0.1196 | 143.2 | 40.6 | 75 | 259 | 12.01 | 10.22 | 14.31 | 12.85 | 14.13 | 10.22 | 17.16 | 10.85 | 12.12 | 11.49 | 11.59 | 11.01 | 11.89 | 5.82 | 7.79 | 6.53 | 9.17 | 5.73 | 7.69 |
| 54-11ga | 20 | 4 | D | 0.1196 | 143.2 | 81.2 | 150 | 374 | 14.60 | 10.34 | 12.81 | 12.88 | 13.45 | 11.28 | 16.18 | 11.18 | 12.36 | 11.60 | 11.59 | 11.26 | 11.55 | 5.79 | 5.36 | 6.58 | 6.59 | 5.72 | 5.64 |
| 6-11ga | 20 | 15 | S | 0.1196 | 143.2 | 86.8 | 75 | 305 | 13.79 | 10.03 | 12.35 | 12.94 | 13.97 | 11.52 | 16.12 | 10.98 | 12.24 | 10.33 | 11.51 | 11.06 | 11.88 | 5.53 | 5.61 | 6.57 | 6.58 | 5.78 | 5.67 |
| 59-11ga | 20 | 15 | D | 0.1196 | 143.2 | 173.6 | 150 | 467 | 16.73 | 10.29 | 12.08 | 12.92 | 13.27 | 11.33 | 16.21 | 11.13 | 12.31 | 10.56 | 11.67 | 11.23 | 11.68 | 5.79 | 5.75 | 6.55 | 6.70 | 5.80 | 5.64 |
| 19-11ga | 30 | 4 | S | 0.1196 | 225.4 | 40.6 | 75 | 341 | 16.66 | 9.93 | 15.76 | 12.74 | 13.54 | 10.41 | 15.46 | 12.56 | 12.29 | 12.05 | 11.99 | 11.84 | 12.35 | 5.77 | 5.97 | 6.67 | 6.89 | 5.71 | 6.01 |
| 72-11ga | 30 | 4 | D | 0.1196 | 225.4 | 81.2 | 150 | 457 | 20.00 | 10.50 | 15.45 | 12.98 | 13.65 | 11.31 | 15.25 | 11.84 | 12.26 | 12.27 | 12.05 | 11.31 | 12.42 | 5.80 | 5.92 | 6.78 | 7.11 | 5.70 | 6.00 |
| 24-11ga | 30 | 15 | S | 0.1196 | 225.4 | 86.8 | 75 | 387 | 18.67 | 9.95 | 15.57 | 12.90 | 14.81 | 11.13 | 14.81 | 11.65 | 12.21 | 12.11 | 11.86 | 11.93 | 12.51 | 5.76 | 5.99 | 6.64 | 6.88 | 5.72 | 5.99 |
| 77-11ga | 30 | 15 | D | 0.1196 | 225.4 | 173.6 | 150 | 549 | 22.30 | 10.49 | 13.64 | 12.81 | 13.52 | 10.70 | 15.11 | 11.98 | 12.20 | 12.33 | 12.10 | 12.00 | 12.52 | 5.79 | 5.94 | 6.77 | 7.17 | 5.81 | 5.99 |
| 78-11ga | 30 | 20 | S | 0.1196 | 225.4 | 152.0 | 75 | 452 | 20.60 | 10.54 | 14.90 | 12.80 | 13.76 | 11.48 | 14.92 | 11.70 | 12.19 | 12.07 | 12.09 | 11.79 | 12.47 | 5.77 | 5.95 | 6.75 | 6.93 | 5.79 | 5.95 |
| 79-11ga | 30 | 20 | D | 0.1196 | 225.4 | 303.0 | 150 | 678 | 24.60 | 10.65 | 16.06 | 12.97 | 14.13 | 10.63 | 15.06 | 12.26 | 12.26 | 12.18 | 12.26 | 12.02 | 12.54 | 5.96 | 6.01 | 7.09 | 7.13 | 5.87 | 5.94 |
| 19-7ga | 30 | 4 | S | 0.1880 | 354.3 | 40.6 | 75 | 470 | 16.20 | 10.52 | 16.03 | 13.33 | 14.05 | 12.19 | 18.39 | 13.75 | 13.33 | 7.49 | 7.80 | ||||||||
| 72-7ga | 30 | 4 | D | 0.1880 | 354.3 | 81.2 | 150 | 586 | 18.98 | 13.47 | 14.46 | 13.65 | 13.49 | 7.49 | 8.24 | ||||||||||||
| 24-7ga | 30 | 15 | S | 0.1880 | 354.3 | 86.8 | 75 | 516 | 17.82 | 13.35 | 13.89 | 13.54 | 13.35 | 7.38 | 7.82 | ||||||||||||
| 77-7ga | 30 | 15 | D | 0.1880 | 354.3 | 173.6 | 150 | 678 | 21.21 | 13.26 | 13.59 | 13.91 | 13.49 | 7.51 | 8.13 | ||||||||||||
| 27-7ga | 30 | 30 | S | 0.1880 | 500.0 | 212.0 | 75 | 787 | 24.30 | 31.33 | 29.98 | 32.21 | 26.99 | 33.17 | 30.71 | 17.59 | 17.50 | 10.98 | 10.90 | ||||||||
| 35-11ga | 40 | 4 | S | 0.1196 | 367.4 | 40.6 | 75 | 483 | 21.23 | 9.33 | 15.40 | 12.69 | 12.27 | 10.46 | 13.59 | 12.50 | 13.64 | 13.34 | 13.05 | 13.07 | 13.21 | 6.13 | 6.53 | 7.24 | 7.23 | 6.45 | 6.13 |
| 88-11ga | 40 | 4 | D | 0.1196 | 367.4 | 81.2 | 150 | 599 | 24.85 | 9.89 | 17.35 | 12.61 | 12.43 | 10.34 | 18.49 | 13.21 | 12.99 | 13.58 | 13.49 | 12.89 | 13.60 | 6.32 | 6.78 | 7.55 | 7.59 | 6.55 | 6.45 |
| 40-11ga | 40 | 15 | S | 0.1196 | 367.4 | 86.8 | 75 | 529 | 23.21 | 10.40 | 14.77 | 12.78 | 12.43 | 10.34 | 13.77 | 12.76 | 13.69 | 13.33 | 13.28 | 13.00 | 13.39 | 6.27 | 6.48 | 7.40 | 7.33 | 6.46 | 6.33 |
| 93-11ga | 40 | 15 | D | 0.1196 | 367.4 | 173.6 | 150 | 691 | 27.56 | 10.16 | 17.09 | 12.75 | 12.28 | 10.68 | 18.07 | 13.50 | 13.99 | 13.64 | 13.55 | 13.15 | 13.40 | 6.36 | 6.79 | 7.57 | 7.70 | 6.67 | 6.46 |
| 41-11ga | 40 | 20 | S | 0.1196 | 367.4 | 151.5 | 75 | 594 | 25.29 | 10.30 | 15.00 | 13.06 | 12.12 | 10.90 | 13.96 | 12.91 | 13.75 | 13.45 | 13.40 | 12.83 | 13.39 | 6.25 | 6.65 | 7.42 | 7.46 | 6.53 | 6.52 |
| 94-11ga | 40 | 20 | D | 0.1196 | 367.4 | 303.0 | 150 | 820 | 30.04 | 10.18 | 15.92 | 12.91 | 12.57 | 10.41 | 18.17 | 13.39 | 14.13 | 13.84 | 13.72 | 13.36 | 13.36 | 6.55 | 6.67 | 7.61 | 7.72 | 6.59 | 6.58 |
| 35-7ga | 40 | 4 | S | 0.1880 | 578.0 | 40.6 | 75 | 694 | 20.59 | 11.04 | 17.36 | 13.70 | 12.47 | 11.11 | 15.50 | 15.73 | 15.72 | 9.00 | 8.62 | ||||||||
| 88-7ga | 40 | 4 | D | 0.1880 | 578.0 | 81.2 | 150 | 809 | 23.43 | 13.35 | 12.38 | 15.85 | 15.78 | 9.07 | 8.89 | ||||||||||||
| 40-7ga | 40 | 15 | S | 0.1880 | 578.0 | 86.8 | 75 | 740 | 22.10 | 13.29 | 12.71 | 15.61 | 15.50 | 8.75 | 8.70 | ||||||||||||
| 93-7ga | 40 | 15 | D | 0.1880 | 578.0 | 173.6 | 150 | 902 | 25.69 | 13.88 | 12.84 | 16.06 | 15.90 | 9.20 | 8.91 | ||||||||||||
| 41-7ga | 40 | 20 | S | 0.1880 | 578.0 | 151.5 | 75 | 804 | 23.78 | 13.41 | 12.53 | 15.78 | 16.07 | 9.04 | 8.79 | ||||||||||||
| 94-7ga | 40 | 20 | D | 0.1880 | 578.0 | 303.0 | 150 | 1031 | 27.94 | 14.08 | 17.63 | 14.04 | 12.85 | 11.07 | 19.93 | 16.20 | 15.78 | 9.29 | 8.94 | ||||||||
| 48-10ga | 50 | 4 | S | 0.1345 | 467.0 | 40.6 | 75 | 583 | 24.81 | 23.62 | 26.60 | 17.02 | 17.60 | 17.04 | 26.60 | 13.53 | 14.57 | 14.51 | 13.76 | 14.31 | 14.11 | 6.90 | 7.24 | 8.30 | 8.22 | 7.17 | 8.24 |
| 101-10ga | 50 | 4 | D | 0.1345 | 467.0 | 81.2 | 150 | 698 | 28.92 | 14.65 | 29.63 | 15.64 | 15.31 | 18.07 | 21.40 | 14.04 | 14.70 | 14.57 | 13.82 | 14.24 | 14.45 | 7.18 | 7.52 | 8.42 | 8.43 | 7.33 | 7.74 |
| 53-10ga | 50 | 15 | S | 0.1345 | 467.0 | 86.8 | 75 | 629 | 26.94 | 14.48 | 29.73 | 15.56 | 15.37 | 19.98 | 20.58 | 13.59 | 14.59 | 14.48 | 13.64 | 13.99 | 14.37 | 7.17 | 7.69 | 8.34 | 8.54 | 7.36 | 8.09 |
| 106-10ga | 50 | 15 | D | 0.1345 | 467.0 | 173.6 | 150 | 791 | 31.96 | 18.00 | 29.38 | 15.79 | 18.93 | 20.17 | 20.94 | 14.02 | 14.69 | 14.40 | 13.93 | 13.97 | 14.48 | 7.25 | 7.70 | 8.45 | 8.52 | 7.48 | 8.04 |
| 48-7ga | 50 | 4 | S | 0.1880 | 652.1 | 40.6 | 75 | 768 | 24.19 | 25.16 | 29.12 | 16.28 | 15.37 | 20.82 | 27.14 | 15.80 | 15.50 | 9.75 | 9.61 | ||||||||
| 101-7ga | 50 | 4 | D | 0.1880 | 652.1 | 81.2 | 150 | 883 | 27.57 | 16.08 | 17.02 | 15.87 | 15.10 | 10.03 | 9.84 | ||||||||||||
| 53-7ga | 50 | 15 | S | 0.1880 | 652.1 | 86.8 | 75 | 814 | 25.91 | 15.94 | 15.55 | 15.77 | 15.53 | 9.88 | 9.69 | ||||||||||||
| 106-7ga | 50 | 15 | D | 0.1880 | 652.1 | 173.6 | 150 | 976 | 30.19 | 17.50 | 30.40 | 16.72 | 16.11 | 23.60 | 23.83 | 16.08 | 15.32 | 10.30 | 10.10 | ||||||||
| 48-3ga | 50 | 4 | S | 0.2500 | 867.3 | 40.6 | 75 | 983 | 23.75 | 24.28 | 29.72 | 16.82 | 16.01 | 20.27 | 29.64 | 17.47 | 16.93 | 11.21 | 10.99 | ||||||||
| 101-3ga | 50 | 4 | D | 0.2500 | 867.3 | 81.2 | 150 | 1099 | 26.54 | 16.61 | 15.77 | 17.43 | 16.96 | 11.42 | 11.34 | ||||||||||||
| 53-3ga | 50 | 15 | S | 0.2500 | 867.3 | 86.8 | 75 | 1029 | 25.15 | 16.46 | 15.35 | 16.68 | 17.03 | 11.36 | 11.22 | ||||||||||||
| 106-3ga | 50 | 15 | D | 0.2500 | 867.3 | 173.6 | 150 | 1191 | 28.80 | 23.00 | 30.18 | 16.55 | 16.20 | 26.70 | 29.74 | 17.47 | 16.93 | 11.55 | 11.58 | ||||||||
Notes: ![]() = low potential to pass MASH (OIV > 16 ft/s);
= low potential to pass MASH (OIV > 16 ft/s); ![]() = medium potential to pass MASH (14 ft/s < deformation ≤ 16 ft/s); S = single mast arm; D = dual mast arms; blank cells indicate that simulations for these specific impact conditions were not conducted for the given pole configurations.
= medium potential to pass MASH (14 ft/s < deformation ≤ 16 ft/s); S = single mast arm; D = dual mast arms; blank cells indicate that simulations for these specific impact conditions were not conducted for the given pole configurations.
Table 39. Updated longitudinal OIV (ft/s), MASH 3-60, MASH 3-61, and MASH 3-62 ranked based on total system weight.
| Sim. No. | Pole Height (ft) | Mast Arm Length (ft) | Mast Config. | Thickness (in.) | Pole Weight (lb) | Arm Connection (lb) | Mass at Ends (lb) | Weight (lb) | CG (ft) | MASH 3-60 | MASH 3-61 | MASH 3-62 | |||||||||||||||
|---|---|---|---|---|---|---|---|---|---|---|---|---|---|---|---|---|---|---|---|---|---|---|---|---|---|---|---|
| Left 1/4 | Center | Right 1/4 | Left 1/4 | Center | Right 1/4 | Left 1/4 | Center | Right 1/4 | |||||||||||||||||||
| 0 | 25 | 0 | 25 | 0 | 25 | 0 | 25 | 0 | 25 | 0 | 25 | 0 | 25 | 0 | 25 | 0 | 25 | ||||||||||
| 1-11ga | 20 | 4 | S | 0.1196 | 143.2 | 40.6 | 75 | 259 | 12.01 | 10.22 | 14.31 | 12.85 | 14.13 | 10.22 | 17.16 | 10.85 | 12.12 | 11.49 | 11.59 | 11.01 | 11.89 | 5.82 | 7.79 | 6.53 | 9.17 | 5.73 | 7.69 |
| 6-11ga | 20 | 15 | S | 0.1196 | 143.2 | 86.8 | 75 | 305 | 13.79 | 10.03 | 12.35 | 12.94 | 13.97 | 11.52 | 16.12 | 10.98 | 12.24 | 10.33 | 11.51 | 11.06 | 11.88 | 5.53 | 5.61 | 6.57 | 6.58 | 5.78 | 5.67 |
| 19-11ga | 30 | 4 | S | 0.1196 | 225.4 | 40.6 | 75 | 341 | 16.66 | 9.93 | 15.76 | 12.74 | 13.54 | 10.41 | 15.46 | 12.56 | 12.29 | 12.05 | 11.99 | 11.84 | 12.35 | 5.77 | 5.97 | 6.67 | 6.89 | 5.71 | 6.01 |
| 54-11ga | 20 | 4 | D | 0.1196 | 143.2 | 81.2 | 150 | 374 | 14.60 | 10.34 | 12.81 | 12.88 | 13.45 | 11.28 | 16.18 | 11.18 | 12.36 | 11.60 | 11.59 | 11.26 | 11.55 | 5.79 | 5.36 | 6.58 | 6.59 | 5.72 | 5.64 |
| 24-11ga | 30 | 15 | S | 0.1196 | 225.4 | 86.8 | 75 | 387 | 18.67 | 9.95 | 15.57 | 12.90 | 14.81 | 11.13 | 14.81 | 11.65 | 12.21 | 12.11 | 11.86 | 11.93 | 12.51 | 5.76 | 5.99 | 6.64 | 6.88 | 5.72 | 5.99 |
| 78-11ga | 30 | 20 | S | 0.1196 | 225.4 | 152.0 | 75 | 452 | 20.60 | 10.54 | 14.90 | 12.80 | 13.76 | 11.48 | 14.92 | 11.70 | 12.19 | 12.07 | 12.09 | 11.79 | 12.47 | 5.77 | 5.95 | 6.75 | 6.93 | 5.79 | 5.95 |
| 72-11ga | 30 | 4 | D | 0.1196 | 225.4 | 81.2 | 150 | 457 | 20.00 | 10.50 | 15.45 | 12.98 | 13.65 | 11.31 | 15.25 | 11.84 | 12.26 | 12.27 | 12.05 | 11.31 | 12.42 | 5.80 | 5.92 | 6.78 | 7.11 | 5.70 | 6.00 |
| 59-11ga | 20 | 15 | D | 0.1196 | 143.2 | 173.6 | 150 | 467 | 16.73 | 10.29 | 12.08 | 12.92 | 13.27 | 11.33 | 16.21 | 11.13 | 12.31 | 10.56 | 11.67 | 11.23 | 11.68 | 5.79 | 5.75 | 6.55 | 6.70 | 5.80 | 5.64 |
| 19-7ga | 30 | 4 | S | 0.1880 | 354.3 | 40.6 | 75 | 470 | 16.20 | 10.52 | 16.03 | 13.33 | 14.05 | 12.19 | 18.39 | 13.75 | 13.33 | 7.49 | 7.80 | ||||||||
| 35-11ga | 40 | 4 | S | 0.1196 | 367.4 | 40.6 | 75 | 483 | 21.23 | 9.33 | 15.40 | 12.69 | 12.27 | 10.46 | 13.59 | 12.50 | 13.64 | 13.34 | 13.05 | 13.07 | 13.21 | 6.13 | 6.53 | 7.24 | 7.23 | 6.45 | 6.13 |
| 24-7ga | 30 | 15 | S | 0.1880 | 354.3 | 86.8 | 75 | 516 | 17.82 | 13.35 | 13.89 | 13.54 | 13.35 | 7.38 | 7.82 | ||||||||||||
| 40-11ga | 40 | 15 | S | 0.1196 | 367.4 | 86.8 | 75 | 529 | 23.21 | 10.40 | 14.77 | 12.78 | 12.43 | 10.34 | 13.77 | 12.76 | 13.69 | 13.33 | 13.28 | 13.00 | 13.39 | 6.27 | 6.48 | 7.40 | 7.33 | 6.46 | 6.33 |
| 77-11ga | 30 | 15 | D | 0.1196 | 225.4 | 173.6 | 150 | 549 | 22.30 | 10.49 | 13.64 | 12.81 | 13.52 | 10.70 | 15.11 | 11.98 | 12.20 | 12.33 | 12.10 | 12.00 | 12.52 | 5.79 | 5.94 | 6.77 | 7.17 | 5.81 | 5.99 |
| 48-10ga | 50 | 4 | S | 0.1345 | 467.0 | 40.6 | 75 | 583 | 24.81 | 23.62 | 26.60 | 17.02 | 17.60 | 17.04 | 26.60 | 13.53 | 14.57 | 14.51 | 13.76 | 14.31 | 14.11 | 6.90 | 7.24 | 8.30 | 8.22 | 7.17 | 8.24 |
| 72-7ga | 30 | 4 | D | 0.1880 | 354.3 | 81.2 | 150 | 586 | 18.98 | 13.47 | 14.46 | 13.65 | 13.49 | 7.49 | 8.24 | ||||||||||||
| 41-11ga | 40 | 20 | S | 0.1196 | 367.4 | 151.5 | 75 | 594 | 25.29 | 10.30 | 15.00 | 13.06 | 12.12 | 10.90 | 13.96 | 12.91 | 13.75 | 13.45 | 13.40 | 12.83 | 13.39 | 6.25 | 6.65 | 7.42 | 7.46 | 6.53 | 6.52 |
| 88-11ga | 40 | 4 | D | 0.1196 | 367.4 | 81.2 | 150 | 599 | 24.85 | 9.89 | 17.35 | 12.61 | 12.43 | 10.34 | 18.49 | 13.21 | 12.99 | 13.58 | 13.49 | 12.89 | 13.60 | 6.32 | 6.78 | 7.55 | 7.59 | 6.55 | 6.45 |
| 53-10ga | 50 | 15 | S | 0.1345 | 467.0 | 86.8 | 75 | 629 | 26.94 | 14.48 | 29.73 | 15.56 | 15.37 | 19.98 | 20.58 | 13.59 | 14.59 | 14.48 | 13.64 | 13.99 | 14.37 | 7.17 | 7.69 | 8.34 | 8.54 | 7.36 | 8.09 |
| 77-7ga | 30 | 15 | D | 0.1880 | 354.3 | 173.6 | 150 | 678 | 21.21 | 13.26 | 13.59 | 13.91 | 13.49 | 7.51 | 8.13 | ||||||||||||
| 79-11ga | 30 | 20 | D | 0.1196 | 225.4 | 303.0 | 150 | 678 | 24.60 | 10.65 | 16.06 | 12.97 | 14.13 | 10.63 | 15.06 | 12.26 | 12.26 | 12.18 | 12.26 | 12.02 | 12.54 | 5.96 | 6.01 | 7.09 | 7.13 | 5.87 | 5.94 |
| 93-11ga | 40 | 15 | D | 0.1196 | 367.4 | 173.6 | 150 | 691 | 27.56 | 10.16 | 17.09 | 12.75 | 12.28 | 10.68 | 18.07 | 13.50 | 13.99 | 13.64 | 13.55 | 13.15 | 13.40 | 6.36 | 6.79 | 7.57 | 7.70 | 6.67 | 6.46 |
| 35-7ga | 40 | 4 | S | 0.1880 | 578.0 | 40.6 | 75 | 694 | 20.59 | 11.04 | 17.36 | 13.70 | 12.47 | 11.11 | 15.50 | 15.73 | 15.72 | 9.00 | 8.62 | ||||||||
| 101-10ga | 50 | 4 | D | 0.1345 | 467.0 | 81.2 | 150 | 698 | 28.92 | 14.65 | 29.63 | 15.64 | 15.31 | 18.07 | 21.40 | 14.04 | 14.70 | 14.57 | 13.82 | 14.24 | 14.45 | 7.18 | 7.52 | 8.42 | 8.43 | 7.33 | 7.74 |
| 40-7ga | 40 | 15 | S | 0.1880 | 578.0 | 86.8 | 75 | 740 | 22.10 | 13.29 | 12.71 | 15.61 | 15.50 | 8.75 | 8.70 | ||||||||||||
| 48-7ga | 50 | 4 | S | 0.1880 | 652.1 | 40.6 | 75 | 768 | 24.19 | 25.16 | 29.12 | 16.28 | 15.37 | 20.82 | 27.14 | 15.80 | 15.50 | 9.75 | 9.61 | ||||||||
| 27-7ga | 30 | 30 | S | 0.1880 | 500.0 | 212.0 | 75 | 787 | 24.30 | 31.33 | 29.98 | 32.21 | 26.99 | 33.17 | 30.71 | 17.59 | 17.50 | 10.98 | 10.90 | ||||||||
| 106-10ga | 50 | 15 | D | 0.1345 | 467.0 | 173.6 | 150 | 791 | 31.96 | 18.00 | 29.38 | 15.79 | 18.93 | 20.17 | 20.94 | 14.02 | 14.69 | 14.40 | 13.93 | 13.97 | 14.48 | 7.25 | 7.70 | 8.45 | 8.52 | 7.48 | 8.04 |
| 41-7ga | 40 | 20 | S | 0.1880 | 578.0 | 151.5 | 75 | 804 | 23.78 | 13.41 | 12.53 | 15.78 | 16.07 | 9.04 | 8.79 | ||||||||||||
| 88-7ga | 40 | 4 | D | 0.1880 | 578.0 | 81.2 | 150 | 809 | 23.43 | 13.35 | 12.38 | 15.85 | 15.78 | 9.07 | 8.89 | ||||||||||||
| 53-7ga | 50 | 15 | S | 0.1880 | 652.1 | 86.8 | 75 | 814 | 25.91 | 15.94 | 15.55 | 15.77 | 15.53 | 9.88 | 9.69 | ||||||||||||
| 94-11ga | 40 | 20 | D | 0.1196 | 367.4 | 303.0 | 150 | 820 | 30.04 | 10.18 | 15.92 | 12.91 | 12.57 | 10.41 | 18.17 | 13.39 | 14.13 | 13.84 | 13.72 | 13.36 | 13.36 | 6.55 | 6.67 | 7.61 | 7.72 | 6.59 | 6.58 |
| 101-7ga | 50 | 4 | D | 0.1880 | 652.1 | 81.2 | 150 | 883 | 27.57 | 16.08 | 17.02 | 15.87 | 15.10 | 10.03 | 9.84 | ||||||||||||
| 93-7ga | 40 | 15 | D | 0.1880 | 578.0 | 173.6 | 150 | 902 | 25.69 | 13.88 | 12.84 | 16.06 | 15.90 | 9.20 | 8.91 | ||||||||||||
| 106-7ga | 50 | 15 | D | 0.1880 | 652.1 | 173.6 | 150 | 976 | 30.19 | 17.50 | 30.40 | 16.72 | 16.11 | 23.60 | 23.83 | 16.08 | 15.32 | 10.30 | 10.10 | ||||||||
| 48-3ga | 50 | 4 | S | 0.2500 | 867.3 | 40.6 | 75 | 983 | 23.75 | 24.28 | 29.72 | 16.82 | 16.01 | 20.27 | 29.64 | 17.47 | 16.93 | 11.21 | 10.99 | ||||||||
| 53-3ga | 50 | 15 | S | 0.2500 | 867.3 | 86.8 | 75 | 1029 | 25.15 | 16.46 | 15.35 | 16.68 | 17.03 | 11.36 | 11.22 | ||||||||||||
| 94-7ga | 40 | 20 | D | 0.1880 | 578.0 | 303.0 | 150 | 1031 | 27.94 | 14.08 | 17.63 | 14.04 | 12.85 | 11.07 | 19.93 | 16.20 | 15.78 | 9.29 | 8.94 | ||||||||
| 101-3ga | 50 | 4 | D | 0.2500 | 867.3 | 81.2 | 150 | 1099 | 26.54 | 16.61 | 15.77 | 17.43 | 16.96 | 11.42 | 11.34 | ||||||||||||
| 106-3ga | 50 | 15 | D | 0.2500 | 867.3 | 173.6 | 150 | 1191 | 28.80 | 23.00 | 30.18 | 16.55 | 16.20 | 26.70 | 29.74 | 17.47 | 16.93 | 11.55 | 11.58 | ||||||||
Notes: ![]() = low potential to pass MASH (OIV > 16 ft/s);
= low potential to pass MASH (OIV > 16 ft/s); ![]() = medium potential to pass MASH (14 ft/s < deformation ≤ 16 ft/s); S = single mast arm; D = dual mast arms; blank cells indicate that simulations for these specific impact conditions were not conducted for the given pole configurations.
= medium potential to pass MASH (14 ft/s < deformation ≤ 16 ft/s); S = single mast arm; D = dual mast arms; blank cells indicate that simulations for these specific impact conditions were not conducted for the given pole configurations.

Potential to Pass MASH
The expected potential to pass the MASH safety criteria (including roof crush and OIV) for each pole configuration is shown in Table 40. All the tests marked as low potential to pass MASH safety criteria (red-colored cells) were due to either occupant compartment deformation values or OIVs that exceeded MASH limits.
A test marked “Med” indicates a medium potential to pass the MASH criteria, meaning that at least one measure of the safety criteria exceeded the preferred limit in MASH or resulted in a concerning value if no preferred limit exists (i.e., OIV > 14 ft/s or roof crush between 0 and 4 in.).
A test marked “High” indicates a high potential to pass the MASH criteria, meaning that there were no concerns regarding occupant compartment deformation, OIV, ORA, or vehicle instability. The blank cells have not been simulated.
6.2 Analysis of Breakaway Sign Supports – PSST Posts
6.2.1 Full-Scale Crash Testing – PSST Posts
Five full-scale crash tests were conducted on PSST sign support systems to validate the simulation results. Chapter 4 provides a summary of these tests. While the test outcomes did not match perfectly with the simulation results for all five crash tests, the overall conclusions drawn from the computer simulations were still deemed valid.
Table 40. Simulated potential of passing MASH for all pole configurations.
| Sim. No. | Pole Height (ft) | Mast Arm Length (ft) | Mast Config. | Thickness (in.) | Weight (lb) | CG (ft) | MASH 3-60 | MASH 3-61 | MASH 3-62 | |||||||||||||||
|---|---|---|---|---|---|---|---|---|---|---|---|---|---|---|---|---|---|---|---|---|---|---|---|---|
| Left 1/4 | Center | Right 1/4 | Left 1/4 | Center | Right 1/4 | Left 1/4 | Center | Right 1/4 | ||||||||||||||||
| 0 | 25 | 0 | 25 | 0 | 25 | 0 | 25 | 0 | 25 | 0 | 25 | 0 | 25 | 0 | 25 | 0 | 25 | |||||||
| 1-11ga | 20 | 4 | S | 0.1196 | 259 | 12.01 | Med | Med | Med | Med | Med | Low | High | High | High | High | High | High | High | High | High | High | High | High |
| 54-11ga | 20 | 4 | D | 0.1196 | 374 | 14.60 | Med | Med | Med | Low | High | Low | High | High | High | High | High | High | High | High | High | High | High | High |
| 6-11ga | 20 | 15 | S | 0.1196 | 305 | 13.79 | High | Med | Med | Med | Med | Low | High | High | High | High | High | High | High | High | High | High | High | High |
| 59-11ga | 20 | 15 | D | 0.1196 | 467 | 16.73 | Med | High | Med | Med | Med | Low | High | High | High | High | High | High | High | High | High | High | High | High |
| 19-11ga | 30 | 4 | S | 0.1196 | 341 | 16.66 | High | High | Med | High | High | High | High | High | High | High | High | High | High | High | High | High | High | High |
| 72-11ga | 30 | 4 | D | 0.1196 | 457 | 20.00 | High | High | Med | High | High | High | High | High | High | High | High | High | High | High | High | High | High | High |
| 24-11ga | 30 | 15 | S | 0.1196 | 387 | 18.67 | High | Med | Med | High | High | High | High | High | High | High | High | High | High | High | High | High | High | High |
| 77-11ga | 30 | 15 | D | 0.1196 | 549 | 22.30 | High | High | Med | Med | High | High | High | High | High | High | High | High | High | High | High | High | High | High |
| 78-11ga | 30 | 20 | S | 0.1196 | 452 | 20.60 | High | High | Med | High | High | High | High | High | High | High | High | High | High | High | High | High | High | High |
| 79-11ga | 30 | 20 | D | 0.1196 | 678 | 24.60 | High | Low | Med | Med | High | High | High | High | High | High | High | High | High | High | High | High | High | High |
| 19-7ga | 30 | 4 | S | 0.1880 | 470 | 16.20 | High | Low | Med | Med | High | Low | High | High | High | High | ||||||||
| 72-7ga | 30 | 4 | D | 0.1880 | 586 | 18.98 | Low | Low | High | High | High | High | ||||||||||||
| 24-7ga | 30 | 15 | S | 0.1880 | 516 | 17.82 | Med | High | High | High | High | High | ||||||||||||
| 77-7ga | 30 | 15 | D | 0.1880 | 678 | 21.21 | Low | Med | High | High | High | High | ||||||||||||
| 27-7ga | 30 | 30 | S | 0.1880 | 787 | 24.30 | Low | Low | Low | Low | Low | Low | Low | Low | High | High | ||||||||
| 35-11ga | 40 | 4 | S | 0.1196 | 483 | 21.23 | Med | Med | Med | High | High | High | High | High | High | High | High | High | High | High | High | High | High | |
| 88-11ga | 40 | 4 | D | 0.1196 | 599 | 24.85 | High | Low | Low | Med | High | Low | High | High | High | High | High | High | High | High | High | High | High | High |
| 40-11ga | 40 | 15 | S | 0.1196 | 529 | 23.21 | High | Med | Med | Low | High | High | High | High | High | High | High | High | High | High | High | High | High | High |
| 93-11ga | 40 | 15 | D | 0.1196 | 691 | 27.56 | High | Low | Med | Med | High | Low | High | Med | High | High | High | High | High | High | High | High | High | High |
| 41-11ga | 40 | 20 | S | 0.1196 | 594 | 25.29 | High | Med | Med | Low | High | High | High | High | High | High | High | High | High | High | High | High | High | High |
| 94-11ga | 40 | 20 | D | 0.1196 | 820 | 30.04 | High | High | Med | Med | High | Low | High | Med | High | High | High | High | High | High | High | High | High | High |
| 35-7ga | 40 | 4 | S | 0.1880 | 694 | 20.59 | High | Low | Low | Med | High | Low | Med | Med | High | High | ||||||||
| 88-7ga | 40 | 4 | D | 0.1880 | 809 | 23.43 | Low | Med | Med | Med | High | High | ||||||||||||
| 40-7ga | 40 | 15 | S | 0.1880 | 740 | 22.10 | Low | Low | Med | Med | High | High | ||||||||||||
| 93-7ga | 40 | 15 | D | 0.1880 | 902 | 25.69 | Med | High | Med | Med | High | High | ||||||||||||
| 41-7ga | 40 | 20 | S | 0.1880 | 804 | 23.78 | Med | Med | Med | Low | High | High | ||||||||||||
| 94-7ga | 40 | 20 | D | 0.1880 | 1031 | 27.94 | Med | Low | Med | Med | High | Low | Low | Med | High | High | ||||||||
| 48-10ga | 50 | 4 | S | 0.1345 | 583 | 24.81 | Low | Low | Low | Low | Low | Low | Med | Med | Med | Med | Med | Med | High | High | High | High | High | High |
| 101-10ga | 50 | 4 | D | 0.1345 | 698 | 28.92 | Med | Low | Low | Med | Low | Low | Med | Med | Med | Med | Med | Med | High | High | High | High | High | High |
| 53-10ga | 50 | 15 | S | 0.1345 | 629 | 26.94 | Med | Low | Low | Med | Low | Low | Med | Med | Med | Med | Med | Med | High | High | High | High | High | High |
| 106-10ga | 50 | 15 | D | 0.1345 | 791 | 31.96 | Low | Low | Low | Med | Low | Low | Med | Med | Med | Med | Med | Med | High | High | High | High | High | High |
| 48-7ga | 50 | 4 | S | 0.1880 | 768 | 24.19 | Low | Low | Low | Med | Low | Low | Med | Med | High | High | ||||||||
| 101-7ga | 50 | 4 | D | 0.1880 | 883 | 27.57 | Low | Low | Med | Med | High | High | ||||||||||||
| 53-7ga | 50 | 15 | S | 0.1880 | 814 | 25.91 | Low | Med | Med | Med | High | High | ||||||||||||
| 106-7ga | 50 | 15 | D | 0.1880 | 976 | 30.19 | Low | Low | Low | Low | Low | Low | Low | Med | High | High | ||||||||
| 48-3ga | 50 | 4 | S | 0.2500 | 983 | 23.75 | Low | Low | Low | Low | Low | Low | Low | Low | High | High | ||||||||
| 101-3ga | 50 | 4 | D | 0.2500 | 1099 | 26.54 | Low | Med | Low | Low | High | High | ||||||||||||
| 53-3ga | 50 | 15 | S | 0.2500 | 1029 | 25.15 | Low | Med | Low | Low | High | High | ||||||||||||
| 106-3ga | 50 | 15 | D | 0.2500 | 1191 | 28.80 | Low | Low | Low | Low | Low | Low | Low | Low | High | High | ||||||||
Notes: ![]() = low potential to pass MASH;
= low potential to pass MASH; ![]() = medium potential to pass MASH; blank cells were not simulated; S = single mast arm; D = dual mast arms.
= medium potential to pass MASH; blank cells were not simulated; S = single mast arm; D = dual mast arms.
The main factor contributing to the differences between the tests and simulations was identified as the soil strength. The initial simulations had assumed a stronger soil strength, leading to premature post shearing and differing responses of the sign system in some tests. However, through the process of updating the soil properties in the models, more consistent results were achieved, as evidenced in Chapter 5.
6.2.2 Updated Computer Simulation – PSST Posts
The calibrated models were employed to rerun the matrix of simulations to check and update the conclusions from the initial simulation results. Similar to the original analyses, the matrix of simulations included a range of sign support and impact configurations. The panel sizes were diversified from 1 ft × 1½ ft to 4 ft × 5 ft (Figure 153). Sign panels with gauge thicknesses of from 0.08 in. to 0.12 in. were used with some models. In all models, aluminum material was assigned to the sign panels.
The post size chosen for all simulations was a 2¼-in. × 2¼-in. cross-section with a 12-gauge thickness. Maintaining the most common configuration, all models utilized a 7-ft mounting height to the bottom of the sign panel. An anchor size of 2½ in. × 2½ in. with 12-gauge thickness was selected to accommodate the post size. In all simulations, ASTM A1011 Grade 50 steel was used for both the post and anchor. The anchor embedment depth was standardized at 36 in. into the ground for all models. Importantly, the updated soil properties were applied in these models.
The simulations encompassed three MASH impact configurations (Test Nos. 3-60, 3-61, and 3-62) (Figure 154). Furthermore, different impact locations (center, left-side offset, and right-side offset) and impact angles (0 and 25 degrees) were incorporated into the simulations (Figure 155). To provide a concise overview of the parameters, Table 41 highlights the various factors explored in this matrix of simulations.


Table 41. Example of family of devices – PSST sign support.
| Device Family | 2¼-in., 12-gauge Single PSST Sign Support | |
| Identical, Critical Structural Feature | Sign support section and size | 2¼-in., 12-gauge PSST |
| Potential Parameters That Provide Similar Safety Performance Under MASH Impact Conditions | Sign panel size (If applicable, a lower, smaller advisory panel may be considered.) | 1 ft × 1½ ft, 2 ft × 2 ft, 2½ ft × 2½ ft, 3 ft × 3 ft, 3 ft × 4 ft, 4 ft × 5 ft (recommended from NCHRP Project 03-119) |
| Sign panel mounting height | 7 ft (recommended from NCHRP Project 03-119) | |
| Sign panel material | Aluminum (recommended from NCHRP Project 03-119) | |
| Sign panel thickness | 0.08 in., 0.10 in., 0.12 in. | |
| Support embedment/foundation | 36 in. | |
| Presence of wind beams | With and without wind beams | |
Table 42 shows sample results from one of the PSST sign support simulations. A summary table was generated for each of the simulations carried out under this project, and these are included in Appendix L. The table shows the predicted behavior of the PSST sign support, the vehicle, and all the pertinent MASH metrics and evaluations. The basic sign features and impact conditions are indicated in the upper part of the table. In the case shown in Table 42, the sign was made up of a 2¼-in. × 2¼-in. square tube with 12-gauge thickness. The post was anchored using a 2½-in. × 2½-in. square tube with 12-gauge thickness. Both the post and anchor tubes were made from A1011 Grade 50 steel. The sign blank was 1-ft × 1.5-ft in size, 0.08 in. thick, and was made of aluminum. The vehicle model used in this simulation was based on the 1100C MASH test vehicle. The impact condition was that of MASH Test No. 3-60. The impact angle was 0 degrees, and the sign system was offset by one-quarter the vehicle width toward the driver’s side. The pictures in the table show snapshots of the vehicle and sign positions at three points in time from two different views (side and isometric). The visual snapshots provide a convenient means to assess the performance of the sign support. The lower part of the table provides a summary of the MASH crashworthiness evaluation metrics for the condition that was simulated. The summary figures were used to assess the different parameters’ effects on the sign system’s MASH performance and develop guidelines for testing a family of these devices. A considerable amount of information was generated by the simulations.
Table 43 shows a summary of all cases incorporating the results from the updated models. The critical metrics for the PSST system are the OIV, windshield intrusion, and roof deformation. These metrics are included in the table and used to assess whether the cases would meet MASH criteria. Green-shaded cells indicate that the case met all MASH criteria, while red-shaded cells indicate that one or more metrics did not meet MASH. As before, most of the cases that did not meet MASH criteria were attributed to excess windshield penetrations (which must be less than 3 in. with no tearing). A few cases, mostly with the largest panel, did not meet the roof deformation criteria (which must be less than 4 in.).
The upper section of the table displays results from scenarios involving low-speed impacts with a small car (MASH Test No. 3-60). The outcomes closely resembled those of the original models, and all cases subjected to this impact assessment met all MASH criteria. In these instances, the sign system bent at ground level but remained connected to the anchoring sleeve. It continued to deform, passing beneath the vehicle without contacting the vehicle’s windshield or roof. The sole critical factor identified in these cases was the OIV. Notably, as the panel size increased, the OIV also increased. However, even with the largest panel size, the OIV remained below the critical MASH threshold.
Table 42. Sample summary of simulation results.
| Single PSST Post Sign Support System Mounting Height: 7 ft; A1011 Grade 50 Post; Aluminum Panel; Anchor Embedment depth: 36 in. |
||||||||||
| Post Size | Anchor Size | Panel Size | MASH Impact | Impact Location | Impact Angle | Wind Beam | ||||
| 2¼” × 2¼” 12 gauge |
2½” × 2½” 12 gauge |
1’ × 1.5’ 0.08” thick |
3-60 | Center | 0 deg | No | ||||
 |
||||||||||
| Evaluation Criteria | ||||||||||
| B | The test article should readily activate in a predictable manner by breaking away, fracturing, or yielding. | Pass | ||||||||
| D | Detached elements, fragments, or other debris from the test article should not penetrate or show potential for penetrating the occupant compartment, and should not present undue hazard to other traffic, pedestrians, or personnel in a work zone. | Pass | ||||||||
| All deformations of, or intrusions into, the occupant compartment should not exceed limits set forth in Section 5.3 and Appendix E of MASH. [Roof less than 4.0 in. (101.6 mm). windshield-no tear of plastic liner and maximum deformation of 3 in. (76.2 mm)]. | Roof ≤ 4 in. | 0 | Pass | |||||||
| Windshield ≤ 3 in. | 0 | |||||||||
| F | The vehicle should remain upright during and after the collision. The maximum pitch and roll angles are not to exceed 75 degrees. | Max roll (deg.) | 0 | Pass | ||||||
| Max pitch (deg.) | 1 | |||||||||
| H | Longitudinal and lateral OIVs should fall below the preferred value of 10ft/s (3.0m/s), or at least below the maximum allowed value of 16ft/s (4.9m/s). | Vx (m/s) | 5.3 | Pass | ||||||
| Vy (m/s) | 0.0 | |||||||||
| I | Longitudinal and lateral ORAs should fall below the preferred value of 15.0 g, or at least below the maximum allowed value of 20.49 g. | Ax (g) | 0.2 | Pass | ||||||
| Ay (g) | 0.2 | |||||||||
| N | Vehicle trajectory behind the test article is acceptable. | Pass | ||||||||
The middle section of Table 43 presents cases involving the high-speed impact with a small car, specifically MASH Test No. 3-61. Simulations indicated that this impact was the most severe among the three scenarios. In most of these instances, the post sheared off and became detached from the anchor. Consequently, the post and sign blank pivoted toward the vehicle and made contact with the hood, windshield, and/or the roof, contingent on the size of the sign panel. Several of the MASH Test No. 3-61 impact cases failed to meet MASH criteria. The cases that met MASH criteria featured small sign panels. In these scenarios, the post encircled the vehicle and sheared off at the base later in the impact, causing the panel to strike the hood rather than the windshield. However, it is worth noting that even for these cases with small panels, simulations involving offset impacts did not meet MASH criteria. In offset impacts, the post ruptured or separated from the base early in the impact, leading to the sign panel impacting the windshield
Table 43. Summary of simulation results.
| Impact Condition | Impact Locations and Angle | Panel Size | 1’ × 1.5’ | 2’ × 2’ | 2.5’ × 2.5’ | 3’ × 3’ | 3’ × 4’ | 4’ × 5’ | ||||||||||||
|---|---|---|---|---|---|---|---|---|---|---|---|---|---|---|---|---|---|---|---|---|
| Panel Thickness | 0.08 | 0.10 | 0.12 | 0.08 | 0.10 | 0.12 | 0.08 | 0.10 | 0.12 | 0.08 | 0.10 | 0.12 | 0.08 | 0.10 | 0.12 | 0.08 | 0.10 | 0.12 | ||
| MASH 3-60 | Center/0 Deg | OIV (ft/s) | 5.2 | 5.6 | 5.6 | 6.6 | 7.2 | 7.2 | 7.9 | 8.2 | 8.2 | |||||||||
| Windshield Int. (in.) | 0 | 0 | 0 | 0 | 0 | 0 | 0 | 0 | 0 | |||||||||||
| Roof Int. (in.) | 0 | 0 | 0 | 0 | 0 | 0 | 0 | 0 | 0 | |||||||||||
| Driver-Side Offset/0 Deg | OIV (ft/s) | 5.9 | 5.9 | 6.2 | 7.2 | 7.5 | 7.9 | 7.9 | 8.5 | 8.5 | 8.9 | 9.2 | 9.5 | 9.5 | 9.8 | 10.5 | 11.2 | 11.5 | 11.8 | |
| Windshield Int. (in.) | 0 | 0 | 0 | 0 | 0 | 0 | 0 | 0 | 0 | 0 | 0 | 0 | 0 | 0 | 0 | 0 | 0 | 0 | ||
| Roof Int. (in.) | 0 | 0 | 0 | 0 | 0 | 0 | 0 | 0 | 0 | 0 | 0 | 0 | 0 | 0 | 0 | 0 | 0 | 0 | ||
| Pass.-Side Offset/0 Deg | OIV (ft/s) | 5.9 | 5.9 | 5.9 | 7.2 | 7.5 | 7.9 | 8.2 | 8.5 | 8.9 | ||||||||||
| Windshield Int. (in.) | 0 | 0 | 0 | 0 | 0 | 0 | 0 | 0 | 0 | |||||||||||
| Roof Int. (in.) | 0 | 0 | 0 | 0 | 0 | 0 | 0 | 0 | 0 | |||||||||||
| MASH 3-61 | Center/0 Deg | OIV (ft/s) | 3.3 | 6.2 | 6.6 | 6.2 | 6.2 | 6.9 | 6.2 | 5.9 | 6.2 | 6.2 | 5.9 | 3.9 | ||||||
| Windshield Int. (in.) | 0 | 0 | 0 | 0 | 0 | 0 | 1.2T | 4.7T | 8.8T | 8.2T | 4.3T | 0 | ||||||||
| Roof Int. (in.) | 0 | 0 | 0 | 0 | 0 | 0 | 0 | 2.8 | 4.3 | 4.3 | 3.9 | 5.9 | ||||||||
| Center/–25 Deg | OIV (ft/s) | 5.9 | 5.6 | 6.2 | 6.6 | 6.2 | 6.2 | 6.2 | 3.0 | 6.6 | 6.2 | 7.2 | 4.9 | |||||||
| Windshield Int. (in.) | 0 | 0 | 0 | 0 | 0 | 0.7T | 4.3T | 1.2T | 3.1T | 3.1T | 6.7T | 3.3T | ||||||||
| Roof Int. (in.) | 0 | 0 | 0 | 0 | 0 | 0 | 2.362 | 0 | 1.6 | 1.6 | 3.9 | 8.0 | ||||||||
| Center/+25 Deg | OIV (ft/s) | 4.9 | 5.9 | 5.2 | 5.6 | 5.6 | 7.2 | 7.2 | 7.9 | 7.2 | 7.2 | 3.3 | 6.2 | |||||||
| Windshield Int. (in.) | 0 | 0 | 0 | 0 | 0 | 0.4T | 1.6T | 2.0T | 3.1T | 1.8T | 6.3T | 7.9T | ||||||||
| Roof Int. (in.) | 0 | 0 | 0 | 0 | 0 | 0 | 2.4 | 0 | 0 | 0 | 3.6 | 5.1 | ||||||||
| Driver-Side Offset/0 Deg | OIV (ft/s) | 3.3 | 3.6 | 3.3 | 2.6 | 2.6 | 2.6 | 2.6 | 2.6 | 2.6 | 2.6 | 2.6 | 1.0 | |||||||
| Windshield Int. (in.) | 1.2T | 1.6T | 4.2T | 12.4T | 6.8T | 12.5T | 13.0T | 11.8T | 4.7T | 4.7T | 4.1T | 0.1 | ||||||||
| Roof Int. (in.) | 0 | 0 | 0.2 | 3.9 | 0.2 | 4.3 | 3.9 | 3.9 | 3.5 | 3.9 | 3.3 | 2.4 | ||||||||
| Pass.-Side Offset/0 Deg | OIV (ft/s) | |||||||||||||||||||
| Windshield Int. (in.) | ||||||||||||||||||||
| Roof Int. (in.) | ||||||||||||||||||||
| MASH 3-62 | Center/0 Deg | OIV (ft/s) | 2.0 | 2.0 | 2.3 | 2.3 | 2.6 | 2.3 | 1.3 | 2.3 | 2.3 | 2.3 | 2.3 | 2.3 | ||||||
| Windshield Int. (in.) | 0 | 0 | 0 | 0 | 0 | 0 | 0 | 3.9 | 5.5 | 0 | 5.5 | 3.3 | 0 | 3.6 | ||||||
| Roof Int. (in.) | 0 | 0 | 0 | 0 | 0 | 0 | 0 | 4.7 | 2.4 | 0 | 3.0 | 3.2 | 0 | 3.504 | ||||||
| Center/+25 Deg | OIV (ft/s) | 1.6 | 2.0 | 2.0 | 3.0 | 3.9 | 3.0 | 1.6 | 3.0 | 1.6 | 3.3 | 3.0 | 3.0 | |||||||
| Windshield Int. (in.) | 0 | 0 | 0 | 0 | 0 | 0 | 0 | 3.9 | 2.8 | 0 | 2.4 | 1.8 | 0 | 2.205 | ||||||
| Roof Int. (in.) | 0 | 0 | 0 | 0 | 0 | 0 | 0 | 0 | 0.8 | 0 | 1.6 | 2.8 | 0 | 3.0 | ||||||
| Center/–25 Deg | OIV (ft/s) | |||||||||||||||||||
| Windshield Int. (in.) | ||||||||||||||||||||
| Roof Int. (in.) | ||||||||||||||||||||
Notes: ![]() = meets MASH criteria;
= meets MASH criteria; ![]() = does not meet MASH criteria; “T” after intrusion number indicates that tearing is predicted; Int. = intrusion; blank cells, green or red, represent cases that were not run but their outcome was assessed based on results from the other simulations.
= does not meet MASH criteria; “T” after intrusion number indicates that tearing is predicted; Int. = intrusion; blank cells, green or red, represent cases that were not run but their outcome was assessed based on results from the other simulations.
and failing to meet MASH criteria. The early rupture of the post can be attributed to the fact that the vehicle’s rigidity is higher in the corner offset point region compared to the center region. Consequently, higher forces are exerted on the post during offset impacts, leading to earlier detachment from the base. In a few simulations featuring the largest panel sizes, the post also sheared at the base, but due to the increased panel height, the panel primarily impacted the roof, resulting in less deformation of the windshield.
The lower section of Table 43 illustrates the high-speed impact with the pickup truck (MASH Test No. 3-62). The simulations revealed that most of the cases involving smaller sign panels (ranging from 1 ft × 1.5 ft to 2.5 ft × 2.5 ft) conformed to MASH criteria, whereas cases featuring larger sign panels (ranging from 3 ft × 3 ft to 4 ft × 5 ft) did not. The primary reason for failing to meet MASH criteria was excessive intrusion and deformation of the windshield. In scenarios with smaller sign panels, the sign made contact with the hood and did not extend to the windshield. However, as the sign systems increased in height, the panel reached the windshield and the roof, resulting in several cases not meeting the MASH criteria.
Similar to the original conclusions, if all impact configurations are considered (i.e., all three impacts with different angles and locations have to meet all MASH criteria), all PSST sign support configurations would not meet MASH.
6.2.3 Critical Characteristics
The following characteristics were identified after reviewing the simulation results:
- MASH Test No. 3-60 was the least critical of the three impacts for the family of the PSST sign support system considered. This test could be omitted or reduced to only one test with the largest sign panel.
- MASH Test No. 3-61 was the most critical of the three tests for this PSST family of devices. It was noted that the size of the panel affects the MASH performance outcome. Medium-sized panels could be more critical than smaller and larger sizes. Tests with the smallest and largest sign would need to be performed, and based on the outcome of these tests, additional testing may need to be performed (e.g., if the smallest panel hit the hood and the larger panel hit the roof, a test with a size in between would be needed).
- Similar effects were noted for MASH Test No. 3-62. The panel size affects the MASH performance, and the middle panel size could be more critical than the smallest and largest sizes. Testing can start with the smallest and largest sizes, and based on the outcome, additional testing with in-between sizes may be needed.
- It was noted that impact locations and impact angle can have an important effect on the outcome of the test. In some cases, offset impacts and impacts at an angle were more critical than the no-offset impact. In other cases, no-offset impact was more critical. Tests with and without offset are needed.
6.2.4 Conclusions
A matrix of simulations was rerun with the updated models to verify and update the conclusions from the analyses and determine the effects of different parameters on the MASH performance of a family of PSST post sign support systems. The parameters included panel size and thickness, impact angle, impact locations, and presence of wind beam. The simulations showed that the evaluated design did not meet the MASH criteria in almost all configurations. The results were used to identify critical tests to validate the simulation results. Coupled with the full-scale crash testing, preliminary guidelines were developed for testing a family of PSST post systems. The guidelines are discussed in Chapter 7.


