Pay and Working Conditions in the Long-Distance Truck and Bus Industries: Assessing for Effects on Driver Safety and Retention (2024)
Chapter: Appendix B: Analysis of Carrier-Level Safety Data
Appendix B
Analysis of Carrier-Level Safety Data
The goal of this appendix is to provide empirical data documenting trucking company traits that display unique associations with various measures of safety including crashes and different types of violations of traffic safety laws and regulations.1 While the nature of the research design precludes making causal attribution to the carrier traits found to be uniquely related to safety metrics, strong mechanism-based arguments can be advanced as to why these associations should arise (Angrist and Pischke 2010; Astbury and Leeuw 2010). Therefore, there are reasons to believe that the reported findings have an adequate degree of theoretical isolation, defined by Miller et al. (2023, p. 292) as, “the existence of strong and convincing rationale(s) that the theorized mechanisms bring to the reported results.”
Unfortunately, no publicly available data exists concerning carrier-level truck driver pay schemes, although concerning the latter, piece-rate pay predominate in the truckload (TL) sector (Levy 2023). As such, directly estimating the impact of remuneration, both total amounts and approaches,
___________________
1 Unique in this context refers to partial correlations, which document the relationship between one variable (X) and a second variable (Y) when one or more other variables (Z1–Zk) are held constant (Darlington and Hayes 2016)
is not statistically feasible with available data.2 However, two observable carrier traits should be correlated with factors under the scope of this study: carrier size and reliance on leased-on owner-operator capacity (as opposed to employee drivers). Specifically, larger carriers are known to have higher rates of driver turnover than smaller carriers per data from the American Trucking Association.3 However, substantial evidence exists that larger carriers are more compliant with safety rules (Scott and Nyaga 2019; Miller et al. 2020; Balthrop et al. 2023), suggesting that these firms may be able to devise operating routines (Zollo and Winter 2002) that ensure safety compliance despite higher rates of turnover (Miller et al. 2017). Concerning use of leased-on owner-operators, as described in Chapters 3 and 4, they receive a higher remuneration rate than employee drivers because they need to cover the cost of owning the trucks they drive. This higher rate of remuneration can create greater incentives to violate safety rules (Miller et al. 2018) and can make leased-on owner-operators more resistant to actions that reduce near-term productivity (Miller et al. 2022). However, leased-on owner-operators’ ownership of their trucks should give them stronger incentives to avoid actions that harm their trucks’ value (Baker and Hubbard 2004).
To evaluate these issues, the empirical analysis began with the population-level data covering the for-hire trucking sector. Because the Motor Carrier Census Files cannot readily be utilized to identify the population of for-hire carriers, the decision was made to rely on the population of large trucking companies (with 100 or more power units as of their January 2017 Motor Carrier Census) utilized in prior research to study motor carrier safety (Miller et al. 2018, 2020) and productivity (Muir et al. 2019). After applying a series of filters to limit the sample to combination-truck carriers4
___________________
2 Even if these data were available, the fact that remuneration strategies appear to be strongly correlated with the types of operations carriers conduct (Ouellet 1994) would raise substantial challenges with achieving statistical identification of remuneration strategies. For example, it is likely that unobserved carrier characteristics that theoretically reside upstream from the selection of payment approaches (e.g., financial well-being, management’s prioritization of safety, management’s prioritization of keeping drivers’ pay stable) could also be partially correlated with safety compliance that would cause substantial bias in the regression weights for the remuneration strategies (Miller and Kulpa 2022).
3 The most recent large-scale survey that collected data on driver turnover from 2011 used a sample of N = 363 carriers and revealed a correlation between the natural logarithm of driver turnover and the natural logarithm of carrier size to be r = 0.32 (95% confidence interval [0.22, 0.41]), which is consistent with this argument.
4 Combination-truck carriers refer to carriers where at least 70 percent of power units are truck-tractors, as opposed to straight trucks (FMCSA 2023; https://csa.fmcsa.dot.gov/Documents/SMSMethodology.pdf). We focus on combination carriers because straight trucks are typically utilized for shorter distance hauls, as opposed to over-the-road operations that are central to this research.
that had valid Compliance, Safety, and Accountability (CSA) records for at least three occasions based on data pulled from December 2010, 2012, 2014, 2016, 2018, 2020, and 2022 where each CSA score5 required a carrier have 20 driver inspections and 20 average power units. This resulted in a sample of N = 1,365 firms that operated 615,128 average power units. While these data are not representative of the entire industry, the 2017 Economic Census from U.S. Census Bureau (2023) documents a population of 1,451 firms in truck transportation (NAICS 484) that had 100 or more employees, with these firms accounting for 55.5 percent of revenue and 58.9 percent of employment.6 Thus, our data capture a wide section of the motor carrier population. In total, with the unbalanced panel structure, there are 8,872 records for analysis.
Six measures of carrier safety were examined for these N = 1,365 firms. These measures were Unsafe Driving Violations, Hours-of-Service Violations, Vehicle Maintenance Violations, Fatal Crashes, Injury Crashes, Towaway Crashes. The violation data were obtained from the FMCSA through the CSA program, whereas the crash data were obtained from the Motor Carrier Management Information System (MCMIS) database.7 We elected to utilize the count of violations, as opposed to CSA BASIC scores for the three violation metrics, given that the FMCSA is planning to move forward with a simplified set of severity weights with just two levels of violation.8 As all these variables are counts, analyses connecting right-hand side variables to these safety metrics was conducted by estimating negative binomial panel regression models9 using generalized estimating equations (GEEs) with robust standard errors using an exchangeable working covariance structure for the residuals using PROC GENMOD in SAS Version 9.4
___________________
5 Data were obtained December of every other year given the CSA data stretch back 2 years (e.g., December 2010 captures data over the prior 24 months). Crash data were likewise obtained in 2-year bins.
6 See https://data.census.gov/table?y=2017&n=484&tid=ECNSIZE2017.EC1700SIZEEMPFIRM.
7 See https://csa.fmcsa.dot.gov/Documents/SMSMethodology.pdf.
8 See https://public-inspection.federalregister.gov/2023-02947.pdf.
9 The negative binomial regression model is ideally suited for the analysis of count data. It incorporates a natural logarithm link function relating the dependent variable to a vector of predictors (Gardner et al. 1995). The residuals are assumed to follow a negative binominal distribution, which accounts for over-dispersion relative to if the data arouse through a counting process (Allison 2012).
(Allison 2012). To improve the interpretability of results, offsets10 were utilized for each dependent variable. The natural logarithm of average power units served as the offset for Unsafe Driving Violations and the three crash measures; the natural logarithm of driver inspections served as the offset for Hours-of-Service Violations, and the natural logarithm of vehicle inspections served as the offset for maintenance violations. Using offsets in this manner, discussed in Allison (2012, Chapter 9), is ideal because it allows us to interpret regression parameters as crashes per power unit, unsafe driving violations per power unit, hours-of-service violations per inspection, and vehicle maintenance violations per inspection.
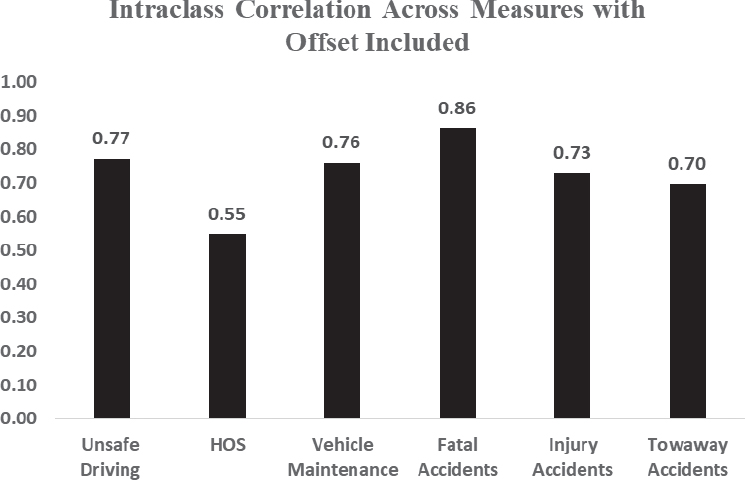
The first series of analyses sought to isolate the share of the variance in these six safety metrics that is stable between-carrier differences versus change within carriers over the 14 years11 of operations covered by our data. To do this, we calculate the intraclass correlations (ICCs) for these metrics by estimating a series of generalized linear mixed models using the GLIMMIX procedure in SAS using Gaussian quadrature to obtain subject-specific estimates using full information maximum likelihood (Fitzmaurice et al. 2012). ICCs are estimated using the offsets to normalize the respective measures. The plot of ICCs is shown in Figure B-1.
In all instances, ICCs exceed 0.5 (indicating the majority of variance resides as stable differences between carriers, even after normalizing for average power units or inspections). Furthermore, outside of Hours-of-Service Violations, which showed substantial declines over the observation period due, in part, to the implementation of the electronic logging device mandate in late 2017 and early 2018 (Miller et al. 2020; Scott et al. 2020), ICCs exceed 0.7, pointing toward the dominance of stable between-carrier factors. In other words, large carriers with good CSA scores tend to have those good scores consistently over time and large carriers with poor CSA scores also tend to have poor scores consistently over time. That this holds for crash rates is especially telling, because it rules out arguments that crashes are random events (if crashes were largely random, then we would expect low ICCs).
For the formal analysis, we regress each of these safety metrics on an extensive set of predictors. The two predictors of most interest are Carrier Size, measured as the natural logarithm of average power units for each
___________________
10 An offset is a statistical approach for improving interpretability in count variable models whereby the relationship between the dependent variable and an independent variable is set at 1.0 (Allison 2012). Given a negative binomial regression model utilizes a natural logarithm link function, if the offset is also expressed as the natural logarithm of some variable, then the offset serves as a constant elasticity (Allison 2012). Intuitively, an offset provides a control for the amount of exposure to the occurrence of outcome being examined, which may vary across observations.
11 Fourteen years refers to 2009–2022 (inclusive).
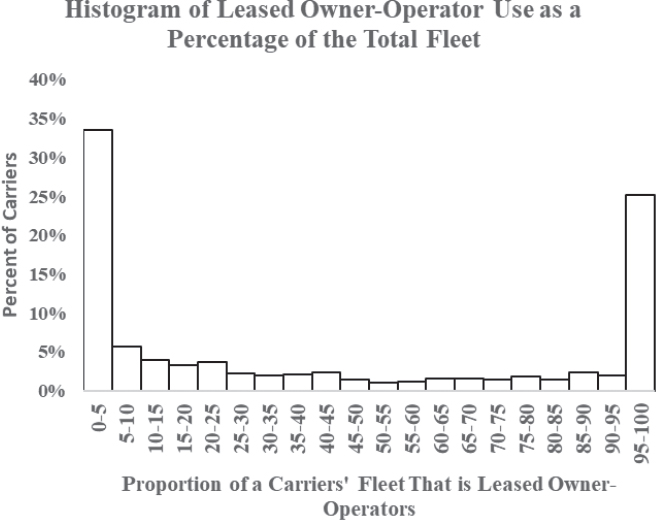
observed record, and Leased Owner-Operator Use, which is the ratio of term or trip leased power units over total power units as of the 2017 Motor Carrier Census. Importantly, Leased Owner-Operator Use is highly stable across carriers, given that the decision to utilize employee versus leased capacity is a major strategic decision (Miller et al. 2022). Furthermore, this measure has a strong bimodal distribution (see Figure B-2), which indicates that estimated comparisons will be between carriers that use employee drivers nearly exclusively, versus those that almost exclusively use lease owner-operators. In addition to these predictors, we include multiple control variables including:
- A vector of six dummy variables to hold constant the measurement occasion (note, six predictors are included, given seven measurement occasions). This removes any stable variance over time due to the rollout of the CSA program in 2010, the implementation of the electronic logging device mandate in 2017–2018, and changes in traffic patterns with the onset of the COVID-19 pandemic.
- A vector of 12 dummy variables capturing carriers’ primary type of commodity/equipment. We include these controls because the choice of commodity/equipment can affect how drivers are paid (Lafontaine and Masten 2002), the nature of hauls (e.g., carriers
- The natural logarithm of the average age of each carrier across all inspections. This control was included given strong evidence of learning curve effects as they pertain to both crashes (Corsi and Fanara 1989) and safety compliance (Miller et al. 2018).
- A 0/1 dummy variable labeled Truckload that equals 1 for carriers whose operations are primarily truckload versus those whose operations are primarily less-than-truckload (LTL). We include this control because LTL carriers operate repeated routes, which
hauling specialized commodities like dry bulk, hazardous chemicals, U.S. mail, or motor vehicles tend to have a limited number of routes vis-à-vis general freight carriers). The commodity/equipment categories are Diversified,12 Drive Away,13 Dry and Liquid Bulk, Flatbed, Heavy Haul, Household Goods, Intermodal Drayage, Mail, Motor Vehicles, Tank-Hazardous, and Temperature Controlled (with General Freight as the omitted category).
___________________
12 Diversified carriers referred to firms whose Motor Carrier Census files indicate an array of commodities hauled and whose websites list that they provide a variety of services without a clear indication that one service is dominant.
13 Drive away carriers provide only power units, not trailers. These firms are often called “power only” trailers.
- The percentage of a carrier’s fleet that was tractors versus straight trucks in the 2017 Motor Carrier Census. Although our filter for combination carriers required that at least 70 percent of power units be tractors (semi-trucks), we want to hold constant the fleet composition, given straight trucks tend to be utilized for shorter distance hauls, which can affect both compensation approaches (e.g., more hourly pay) and exposure to both inspections and traffic.
- A 0/1 dummy variable indicating whether a carrier is certified to haul hazardous materials in the 2017 Motor Carrier Census. We include this control, given that carriers certified to haul hazardous materials are subject to more stringent scrutiny by the FMCSA (e.g., their percentile performance for receiving a warning is the 60th percentile for Unsafe Driving, as opposed to the 65th percentile for other carriers), and these carriers have a greater incentive to operate safely, given the higher damages that could happen if crashes occur.
- The miles per power unit carriers drive using the Utilization Factor provided by the FMCSA as part of its CSA program.
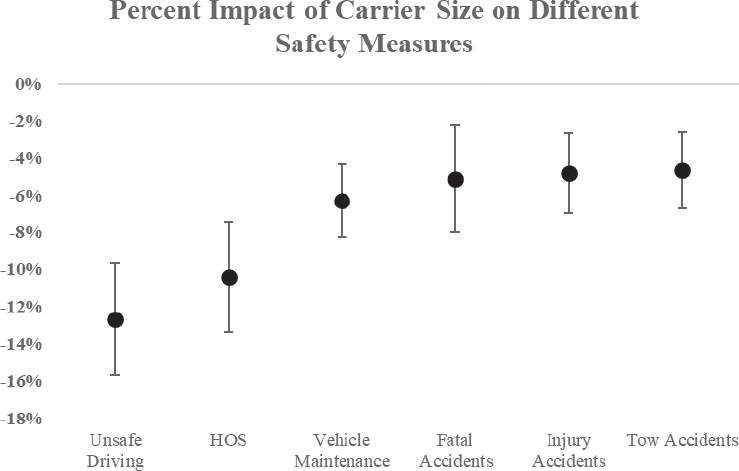
- A vector of four dummy variables to indicate the region in which a carrier is headquartered based on the Census Bureau’s four regions plus Canada. For interpretability, we report the results for our two focal predictors on each of the six safety metrics from the negative binominal GEE models with offsets on a percentage basis (Allison 2012) as eβ – 1, where β represents the regression weight of the focal predictor. Figure B-3 reports the results for Leased Owner-Operator Use, whereas Figure B-4 reports the results for Carrier Size. In these figures, the error bars represent 95 percent confidence intervals for the estimated effects.
allows drivers to develop familiarity with operations. Data from the American Trucking Associations also indicates that LTL carriers have driver turnover rates that are far less than large TL carriers (e.g., 12% versus 90%).
Starting with Figure B-3, Leased Owner-Operator Use has no partial correlation with Unsafe Driving or Fatal Crashes. This variable is strongly related to violations in the Hours-of-Service Compliance and Vehicle Maintenance domains. Carriers whose fleets are entirely composed of leased-on owner-operators have 32 percent more hours-of-service violations and 27 percent more vehicle maintenance violations than carriers whose fleets are entirely employee drivers, other observed factors held constant. However, Leased Owner-Operator Use is negatively related to the number of injury crashes and crashes that required a vehicle be towed. Carriers whose fleets
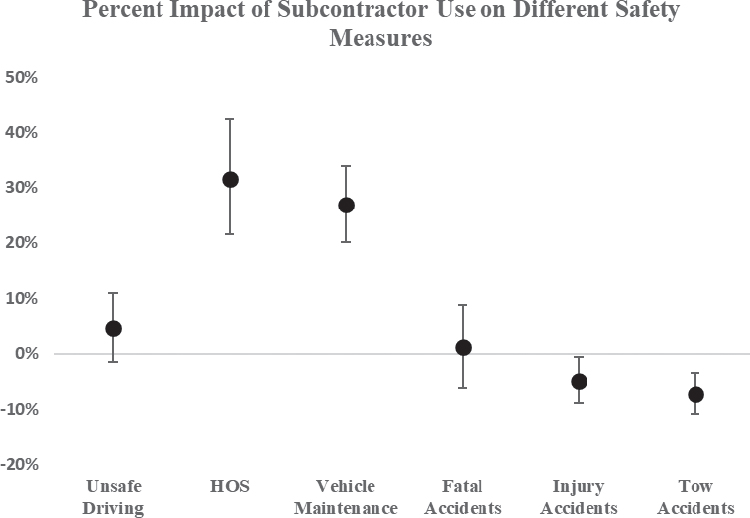
are entirely composed of leased-on owner-operators have ~5 percent fewer injury crashes and 7 percent fewer crashes requiring a vehicle be towed than carriers whose fleets are entirely employee drivers, other observed factors held constant. While theoretical explanations exist for carriers using leased-on owner-operator capacity having higher hours-of-service and vehicle maintenance violation rates (Miller et al. 2018), there is no clear explanation for the lower rate of crashes. For example, this could stem from drivers having more experience—something that we can unfortunately not hold constant—or unobservable characteristics about the types of routes operated.
For Carrier Size, larger carriers have lower rates of violations, as well as crashes, other observed factors held constant (see Figure B-4). For example, a doubling of carrier size (100% increase) is associated with a 14 percent decrease in Unsafe Driving Violations, other observed factors held constant. Given that larger carriers tend to have higher rates of driver turnover and driver turnover is positively relative to safety violations (Miller et al. 2018), this suggests that the association with Carrier Size is being estimated conservatively, because including a measure of carrier-level turnover would result in what is called suppression, which would shift the effect of Carrier Size more to the negative. To understand why, note that we observe in Figure B-5 that the effect of Carrier Size holding constant all other predictors is negative (top part of the figure), captured by parameter δ. As shown in the bottom part of the figure, driver turnover rates reside theoretically downstream from carrier size, with carrier size having a positive relationship with turnover rates, other factors held constant (captured by parameter α). Furthermore, findings from Miller et al. (2017) imply that, holding carrier size and other relevant carrier traits constant, driver turnover rates are positively related to safety violations (captured by parameter β). Moreover, holding driver turnover and other relevant factors constant, we would expect carrier size to have a negative relationship with safety violations (captured by parameter γ). Critically, a mathematical property of regression models is that δ = γ + α*β (Mackinnon 2012). As we expect the term α*β to be positive, whereas will be negative, we have reason to expect (the parameter we do estimate in our models) is being under-estimated vis-à-vis if driver turnover was included14 as a predictor. This finding suggests that carrier operating routines might be mitigating consequences of driver turnover and facilitating motor carrier safety through their greater incentives to be compliant (e.g., due to a larger number of inspections, greater brand equity at stake) (Miller 2020). However, because carrier behaviors
___________________
14 If interested in estimating the total effect of Carrier Size on different safety violations, it would not be appropriate to include a measure of driver turnover as another predictor because driver turnover resides theoretically downstream from carrier size (Miller and Kulpa 2022).
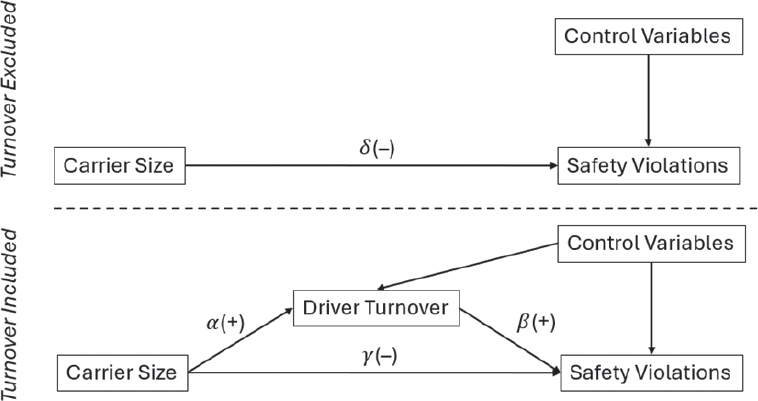
are unobserved in this dataset, it is impossible to know from the data relied on for the analyses in this Addendum how carriers might be mitigating the consequences of turnover.
Returning to Figure B-4, our results also suggest a doubling of carrier size (100% increase) is associated with a 5 percent decrease in Fatal Crashes, Injury Crashes, and Tow Crashes, all other observed factors held constant. To the extent that higher rates of driver turnover are associated with more frequent crashes, this further suggests that excluding driver turnover results in these estimates being conservative due to suppression.
Two additional sets of analyses were performed to examine the relationship between different violation types and both Fatal Crashes and Injury Crashes. These analyses used the natural logarithm of the SMS BASIC scores for each violation category. The models were estimated with the full sets of predictors15 and each violation type was then included to isolate partial correlations; violation types were entered individually because they tend to strongly correlate. Figure B-6 shows the effects for Fatal Crashes, whereas Figure B-7 shows the effects for Injury Crashes.
The clear pattern we observe is that all three types of violations are positively associated with crash rates. Figure B-6 indicates that a doubling (100% increase) of the Unsafe Driving BASIC scores is associated with a 30 percent increase in fatal crash rates. In contrast, a doubling (100% increase)
___________________
15 In other words, we included every variable used in the models to obtain estimates for Figures B-5 and B-6.
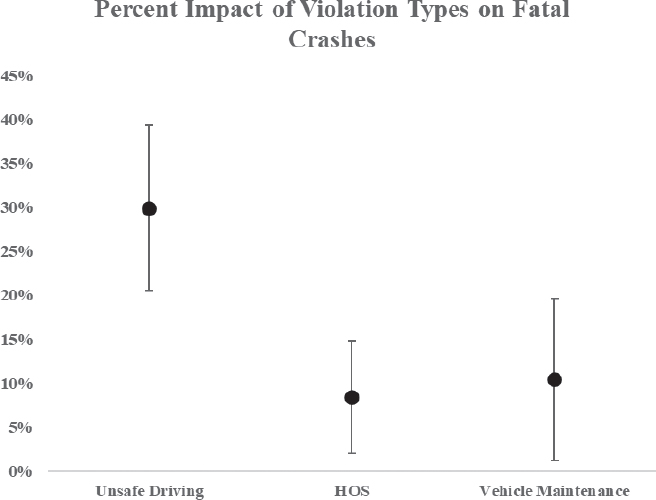
of the Hours-of-Service Compliance BASIC scores is associated with an 8 percent increase in fatal crash rates; the comparative statistic is 10 percent for Vehicle Maintenance BASIC scores. This suggests that unsafe driving behaviors such as speeding, using a cellphone while operating a commercial vehicle, and dangerous lane changes are more strongly16 linked to fatal crashes than are behaviors such as exceeding daily or weekly work hours, a result we would expect given the proximal relationship between unsafe driving and crashes (Scott et al. 2021).
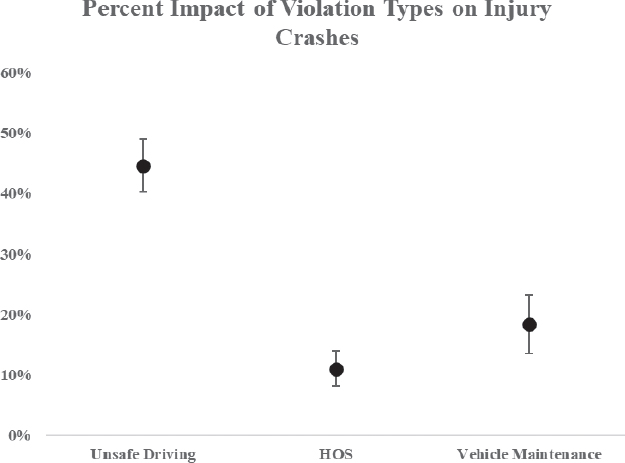
Turning to Figure B-7, we see a similar pattern of findings. Figure B-7 indicates that a doubling (100% increase) of the Unsafe Driving BASIC scores is associated with a 45 percent increase in injury crash rates. In contrast, a doubling (100% increase) of the Hours-of-Service Compliance BASIC scores is associated with an 11 percent increase in injury crash rates; the comparative statistic is 18 percent for Vehicle Maintenance BASIC scores. It should be noted that these effects are more precisely estimated than in the Fatal Crashes model, likely due to (a) numerous stochastic factors affecting whether a crash results in a fatality and (b) the more frequent nature of injury crashes generating more variance in the dependent variable.
___________________
16 This research did not test whether the magnitudes of these effects are different from one another with statistical significance.
REFERENCES
Allison, P. D. (2012). Logistic regression using SAS: Theory and application. SAS Institute.
Astbury, B., and Leeuw, F. L. (2010). Unpacking black boxes: mechanisms and theory building in evaluation. American Journal of Evaluation, 31(3), 363–381.
Baker, G. P., and Hubbard, T. N. (2004). Contractibility and asset ownership: On-board computers and governance in U.S. trucking. The Quarterly Journal of Economics, 119(4), 1443–1479.
Balthrop, A., Scott, A., et al. (2023). How do trucking companies respond to announced versus unannounced safety crackdowns? The case of government inspection blitzes. Journal of Business Logistics, 44(4), 641–665.
Corsi, T. M., and Fanara, Jr., J. P. (1988). Driver management policies and motor carrier safety. The Logistics and Transportation Review, 24, 153–163.
Darlington, R. B., and Hayes, A. F. (2016). Regression analysis and linear models: Concepts, applications, and implementation. Guilford Publications.
Fitzmaurice, G. M., Laird, N. M., and Ware, J. H. (2012). Applied longitudinal analysis. John Wiley & Sons.
Gardner, W., Mulvey, E. P., and Shaw, E. C. (1995). Regression analyses of counts and rates: Poisson, overdispersed poisson, and negative binomial models. Psychological Bulletin, 118(3), 392-404.
Lafontaine, F., and Masten, S. (2002). Contracting in the absence of specific investments and moral hazard: Understanding carrier-driver relations in US trucking. https://www.nber.org/papers/w8859.
Levy, K. (2023). Data driven: Truckers, technology, and the new workplace surveillance. Princeton University Press.
MacKinnon, D. (2012). Introduction to statistical mediation analysis. Routledge.
Miller, J. W., and Kulpa, T. (2022). Econometrics and archival data: Reflections for purchasing and supply management (PSM) research. Journal of Purchasing and Supply Management, 28(3), 100780.
Miller, J. W., Golicic, S. L., et al. (2018a). Reconciling alternative theories for the safety of owner–operators. Journal of Business Logistics, 39(2), 101–122.
Miller, J., Saldanha, J. P., et al. (2018b). How does electronic monitoring affect hours-of-service compliance? Transportation Journal, 57(4), 329–364.
Miller, J. W., Bolumole, Y., and Schwieterman, M. A. (2020). Electronic logging device compliance of small and medium size motor carriers prior to the December 18, 2017, mandate. Journal of Business Logistics, 41(1), 67–85.
Miller, J., Davis‐Sramek, B., Fugate, B. S., Pagell, M., and Flynn, B. B. (2021). Editorial commentary: Addressing confusion in the diffusion of archival data research. Journal of Supply Chain Management, 57(3), 130–146.
Miller, J., Skowronski, K., et al. (2022). Asset ownership and incentives to undertake non-contractible actions: The case of trucking. Journal of Supply Chain Management, 58(1), 65–91.
Miller, J., Balthrop, A., Davis‐Sramek, B., and Richey, Jr., R. G. (2023). Unobserved variables in archival research: Achieving both theoretical and statistical identification. Journal of Business Logistics, 44(3), 292-299.
Muir, W. A., Miller, J. W., et al. (2019). Strategic purity and efficiency in the motor carrier industry: A multiyear panel investigation. Journal of Business Logistics, 40(3), 204–228.
Ouellet, L. J. (1994). Pedal to the metal: The work lives of truckers. Temple University Press.
Scott, A., and Nyaga, G. N. (2019). The effect of firm size, asset ownership, and market prices on regulatory violations. Journal of Operations Management, 65(7), 685–709.
Scott, A., Balthrop, A., and Miller, J. (2020). Unintended responses to IT-enabled monitoring: The case of the electronic logging device mandate. Journal of Operations Management.
Zollo, M., and Winter, S. G. (2002). Deliberate learning and the evolution of dynamic capabilities. Organization Science, 13(3), 339–351.
This page intentionally left blank.


