Pay and Working Conditions in the Long-Distance Truck and Bus Industries: Assessing for Effects on Driver Safety and Retention (2024)
Chapter: 5 Compensation, Working Conditions, and Safe Driving in Long-Distance Trucking
5
Compensation, Working Conditions, and Safe Driving in Long-Distance Trucking
Roughly 3,000 fatal crashes involving combination trucks occurred each year from 2016 to 2021 (FMCSA 2023).1 These crashes resulted in roughly 500 fatalities annually among truck drivers and 2,800 fatalities annually among the occupants of the other vehicles involved in the crash (FMCSA 2023). Annually over this same period, combination trucks have averaged about 52,000 crashes that resulted in about 72,000 non-fatal injuries per year (FMCSA 2023). Only a portion of these crashes involved combination trucks in long-distance truckload (TL) service, and as described later, more than half of multi-vehicle crashes involving combination trucks are attributable to the actions of the drivers of other vehicles. Still, these data reveal the considerable human and economic costs that society bears each year from crashes involving combination trucks, and the importance of finding solutions by examining all potential causal and contributing factors.2
This study charge calls for a review of the research literature and assessment of available data to determine if there are relationships among long-distance truck driver compensation methods, driver retention, driving behaviors, and safety performance. The study is also expected t o consider how other factors may have a bearing on these relationships, such
___________________
1 FMCSA, Large Truck and Bus Crash Facts 2021, November 2023.
2 Congress made this central to the FMCSA upon its creation in 1999: “In carrying out its duties, the [FMCSA] shall consider the assignment and maintenance of safety as the highest priority, recognizing the clear intent, encouragement, and dedication of Congress to the furtherance of the highest degree of safety in motor carrier transportation” (Motor Carrier Safety Improvement Act of 1999).
as driver working conditions and non-wage rewards.3 Regarding the ultimate outcome of interest, “safety performance,” the study committee interprets this to mean the avoidance of crashes and their harmful consequences. However, that outcome depends in part on safe driving behavior, warranting a review of data on truck driver traffic safety violations, such for speeding, and other sources of evidence about driving behaviors such as from naturalistic driving studies.
This chapter reviews the best available empirical evidence about the role of truck driver compensation, non-wage rewards, and working conditions on safe driving behavior and safe outcomes. Before turning to this review, the next section describes how the committee conceived the possible relationships among truck driver compensation, working conditions, retention, and driving behaviors that can affect safety. The discussion starts with an overly simplified depiction of relationships among these variables of interest, before turning to a depiction that accounts more fully for the possible interactions among them. The discussion then incorporates even more influences on safe driving behaviors and outcomes, suggesting the complexity inherent in tracing the potential effects on safety of driver compensation, retention, and working conditions.
While much of the chapter’s discussion focuses on studies of driver behavior and safety, a chapter section also takes into consideration the role of the carrier by describing studies that seek to show an association between carrier-level data on compensation and safety, how industry conditions influence carrier behavior, and how carriers appear to influence driver behaviors in ways that affect safety outcomes. Safety performance differs among long-distance TL carriers, but little is generally known about how carriers with the best safety records manage to achieve better results than their peers, even though all carriers are subject to the highly competitive nature of the industry, use piece-rate compensation, and exhibit high driver turnover.
CONCEPTUAL FRAMEWORK
The overly simplified causal chain implied in the study charge links compensation and working conditions to truck driver behavior and then to safety performance (see Figure 5-1).4 For instance, if compensation and working conditions, considered separately or in combination, encourage drivers to work very long hours, this could contribute to fatigue, a known risk factor
___________________
3 As discussed in Chapter 3, non-wage rewards can include benefits such as health and life insurance, and various kinds of performance-related bonuses.
4 In this figure, non-wage rewards, retention, and detention are subsumed under either compensation or working conditions.
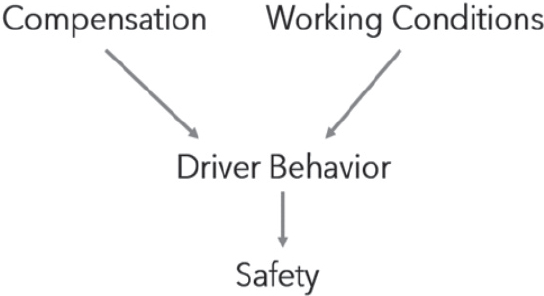
for crashes. Similarly, if compensation or working conditions incentivize speeding or other reckless driving, such as to meet demanding dispatch assignments, this could also increase crash risk.
As described in Chapter 3, pay per mile and pay per load, which are common in the long-distance TL sector, are piece-rate forms of compensation. A way to think about this form of compensation is that a driver is paid for output produced (i.e., load delivered) and that the payment amount (i.e., the piece rate) is usually based on the number of miles that must be driven to transport the load. Hence, the driver knows in advance how much he or she will be paid for transporting the load, unlike hourly pay which will vary depending on how much time is required to do the work. Piece-rate pay can therefore incentivize drivers to maximize the miles driven within regulated hours of service to get the revenue load delivered and to obtain the next revenue load or to return home. In theory, compensation paid at an hourly rate would provide less incentive to maximize miles driven with a given time, and thus potentially reduce the incentive to drive fast. However, matters that would need to be considered when making such comparisons is the relative size of the rates (i.e., how high is the hourly rate or mileage rate?) and the relative effects that the different pay rates and pay schemes can have on a driver’s overall compensation levels and its predictability, which in turn can affect a driver’s interest in working long hours (i.e., maximizing available hours driving during a week or month) with attendant impacts on fatigue.
Figure 5-1 is simplistic for various reasons, including because it neglects several interrelationships. The more detailed graphic in Figure 5-2, for instance, also reflects this study’s interest in driver retention. Chapter 4 discussed retention from the standpoint of a long-distance TL carrier being able to retain drivers in environment where working conditions can
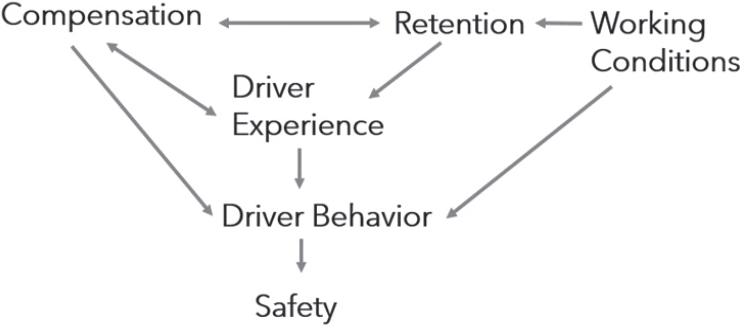
be demanding and pay irregular. That chapter documents how the long-distance TL sector has persistently high driver turnover and low levels of driver retention. However, retention builds driver experience with a carrier, which may also contribute to safety as described later in the section reviewing driver-level studies.5 In addition, experienced drivers may obtain load assignments from dispatchers that offer higher pay rates, lead to more regular compensation, and allow for more schedule predictability, which complicates assessments of the relationships among compensation, working conditions, and safety. Hence, even if compensation itself does not change driver behavior in ways that affect safety, it may seem to be influential inasmuch as experienced drivers with good safety records end up commanding higher compensation.6
The relationships represented in both Figures 5-1 and 5-2, which focus on truck driver compensation, retention, and working conditions, must be considered in the larger context of the myriad factors that influence safety, as partially depicted in Figure 5-3. This figure groups major influences (driver characteristics, working conditions, and carrier characteristics) but ignores the many interactions among them for simplicity of presentation.
___________________
5 Retention can have three meanings: (1) a driver remains with a TL carrier; (2) a driver keeps working in the TL sector but leaves a TL carrier; and (3) a driver remains in the occupation of long-distance trucking but leaves the TL sector. Figure 5-2 considers only the first; however, in principle, an experienced driver with a safe record is an asset to the firm and the industry even if that driver changes firms.
6 Experience can be generally expected to improve skill and thus safety. It may also be that experience tends to weed out drivers who are unsafe due to some persistent personal characteristic (e.g., untreated sleep apnea or risk-seeking behavior that leads to crashes; see Burks et al. 2016b, pp. 3 and 21).
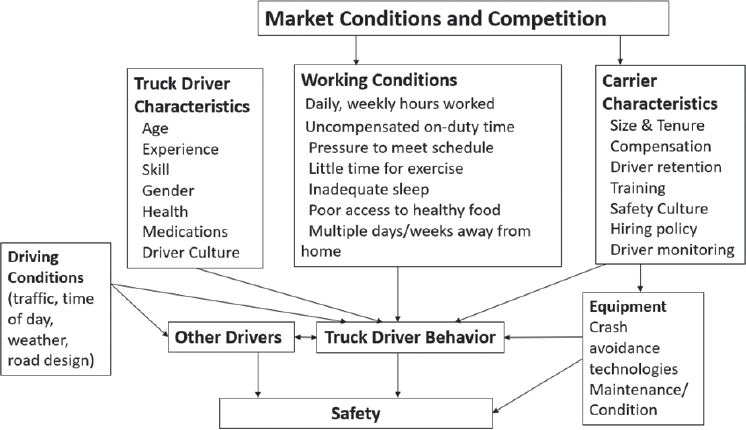
In Figure 5-3, the category “driver characteristics” captures potentially important dimensions, such as skill and experience, health, and driver culture (such as pride in ability to work long hours and provide for a family) (Levy 2023), all of which may influence the safety-related behaviors of drivers in the TL sector. The “working conditions” category gives examples of factors that can influence driver behavior, such as access to restful sleep and healthy food. “Carrier characteristics” lists influences on safety behavior such as training and safety-related policies that carriers may employ to instill a safety culture, along with their compensation programs.
Not listed in Figure 5-3 are the probable interactions across categories, such as the effects of working conditions on driver sleep and health and the effects of a carrier’s training on driver skill and a carrier’s compensation and hiring policy on the experience levels of its drivers. Listed separately from influences on driver behavior are equipment characteristics that influence crash probability directly, such as vehicle condition and availability of crash avoidance technologies. Also independent of these categories of influence are other more proximate contributing causes to crashes, which are usually described in the highway safety literature as the environmental influences on safety, such as weather, lighting, and traffic. These conditions influence other (non-truck) drivers in the traffic stream, who can also be responsible for crashes.
The results of the U.S. Department of Transportation’s (USDOT’s) 2006 Large Truck Crash Causation Study (LTCCS) illustrate the multiple factors
associated with large truck crashes (USDOT 2006, Table 6.1).7 (At the time of this writing in 2024, FMCSA was conducting a new truck crash causation study.8) The 2006 LTCCS collected some 1,000 variables on a sample of 967 crashes involving at least one truck weighing more than 10,000 pounds. Combination trucks represented 75 percent of the trucks involved in the sample. (This study selected crashes on a stratified random sampling basis to be nationally representative, but included all heavy trucks, not just those driven in long-distance operations.)
As shown in Table 5-1, truck driver fatigue, possibly related to piecework compensation and working conditions, is cited as associated with 13 percent of large truck crashes, placing fatigue among the top 6 driver factors associated with crashes. Other relevant behaviors associated with large truck crashes include the driver being under work-related pressure (9.2%) and the driver being pressured to operate despite fatigue (3.2%). Unsafe driving behaviors associated with piece-work compensation, combined with fixed limits on driving hours and schedule pressure, include driving too fast for conditions (22.9%), aggressive driving (6.6%), and following too closely (4.9%). However, other crash-associated factors independent of compensation and working conditions include traffic flow interruption (28%), drivers’ prescription drug use (26.3%), roadway-related factors (20.5%), and weather (14.1%). Note that these factors add to well over 100 percent (and only the top 20 are listed). Moreover, for truck crashes involving passenger vehicles, in 56 percent of these crashes the LTCSS cited the driver of the passenger vehicle as the principal reason for the failures that led to the crash (LTCSS 2006, p. 16).
This multiplicity of associated factors and primary responsibility of passenger vehicle drivers in more than half of truck-passenger vehicle crashes illustrates the multiple contributors to crashes and the challenge of isolating the effects of truck driver compensation and working conditions on these crashes. Several of the studies described later in this chapter have hypothesized how compensation and working conditions should affect safety, but are constrained (due to lack of data) in their ability to control for other important influences on safety such as those described above.
Ideally, professional truck drivers would be vigilant and alert while driving on roads and highways shared with passenger vehicles, cyclists, and pedestrians. Given that they are operating trucks with gross vehicle weights of up to 80,000 lb or more (20 times heavier than the average passenger
___________________
7 The word “associated,” as used in LTCCS, means that the variable was determined by analysts as a condition present at the time of the crash. It is not a statistically derived association or correlation among variables. LTCCS analysts relied on judgment to determine whether conditions present at the time of the crash were contributing causes.
8 See www.fmcsa.dot.gov/CCFP.
TABLE 5-1 Estimated Number of Trucks Involved in Crashes by Associated Factor
| Top 20 Factors | Number of Trucks | Percentage |
|---|---|---|
| Driver | ||
| Prescription drug use | 37,000 | 26.3 |
| Traveling too fast for conditions | 32,000 | 22.9 |
| Unfamiliar with roadway | 30,000 | 21.6 |
| Over-the-counter drug use | 24,000 | 17.3 |
| Inadequate surveillance | 19,000 | 13.2 |
| Fatigue | 18,000 | 13.0 |
| Under work-related pressure | 13,000 | 9.2 |
| Illegal maneuver | 13,000 | 9.1 |
| Inattention | 12,000 | 8.5 |
| External distraction factors | 11,000 | 8.0 |
| Inadequate evasive action | 9,000 | 6.6 |
| Aggressive driving | 9,000 | 6.6 |
| Unfamiliar with vehicle | 9,000 | 6.5 |
| Following too closely | 7,000 | 4.9 |
| False assumption of other road user actions | 7,000 | 4.7 |
| Vehicle | ||
| Brake failure | 41,000 | 29.4 |
| Environment | ||
| Traffic flow interruption | 39,000 | 28.0 |
| Roadway-related factors | 29,000 | 20.5 |
| Driver required to stop before crash | 28,000 | 19.8 |
| Weather-related factors | 20,000 | 14.1 |
| Other | ||
| Cargo shift | 6,000 | 4.0 |
| Driver pressured to operate when fatigued | 5,000 | 3.2 |
| Cargo securement | 4,000 | 3.0 |
| Illness | 4,000 | 2.8 |
| Illegal drug use | 3,000 | 2.3 |
| Alcohol use | 1,000 | 0.8 |
NOTES: Percentages exceed 100% in total due to crashes involving multiple factors. Percentages are also based on the raw counts, not the rounded numbers in column 2.
SOURCE: Large Truck Crash Causation Study, USDOT 2006 (Table 8), www.fmcsa.dot.gov/CCFP.
vehicle) and with far longer stopping distances, they should be exercising good judgment regarding appropriate speed for the conditions, lane keeping, other vehicles in the traffic stream, and braking requirements for crash avoidance. Ideally, drivers would not be fatigued from inadequate sleep or driving excess hours during the day or well into the night or in early morning hours when drowsiness is common. There are multiple plausible pathways that potentially limit the achievement of this ideal state. The text that follows outlines and expands upon the plausible reasons for the effect of compensation, including non-wage rewards, and working conditions on behavior in ways that could affect safety.
Compensation
As described in Chapter 3, almost all drivers in the long-distance TL sector earn their base pay through piece work. They get paid for each output they produce (i.e., load picked up and delivered) and not directly for the time it takes to produce that output. The rate of payment for the load (output) is normally determined by the distance that it must be transported, and in this sense truck drivers can be viewed as being paid by the mile. In this regard, piece-rate compensation incentivizes drivers who want to increase their income to take loads that will allow them to drive as many miles as possible within regulated hours of duty, although these incentives may be affected by fringe benefits and the bonuses for safety and fuel efficiency that some carriers pay.
At the same time, the backward-bending supply curve theory from labor economics (which is described later) predicts that at some point (which will differ by driver) a driver will choose rest, leisure, and opportunities for restorative sleep in lieu of additional income once a desired threshold level of income is reached even if more duty time is available. Such rest should contribute positively to driver alertness, reaction times, and decision-making while driving, all other things being equal. As described later in this chapter, it has proven difficult to demonstrate convincingly the point at which drivers trade income for leisure, although the American Trucking Associations (ATA) agrees that this occurs (ATA 2021, 2022).9 At low pay
___________________
9 There is one available study using a prospective randomized controlled experiment to investigate the effects of increasing the piece rate for transportation workers paid by the trip by 25 percent over a 4-week period (Fehr and Goette 2007). Using a clean design, economists found that only some of the workers (those who were “loss averse”) exhibited a “target income effect,” in which they reduced effort within a given day after reaching a specific income level when the piece rate was increased. These results were for bicycle couriers, so they cannot be directly generalized to long-distance truck drivers, but the study does suggest that not all workers will react the same way to a piece-rate increase.
rates, drivers paid by the mile may work longer hours before they reach their desired income, which may result in inadequate sleep and fatigue.
Drivers who stay with a carrier receive some degree of training and come to know the routines, equipment, and carrier policies that may result in safer driving. Some large carriers offer drivers recruitment bonuses for signing on with a carrier; as well as referral bonuses for referring another experienced driver to the carrier. Other efforts to encourage high-performing drivers to stay with the firm include longevity pay increases, which are typically subject to a cap after several years of service. The non-wage rewards singled out in the study charge take multiple forms.10 Some derive from fringe benefits, such as health insurance and 401(k) retirement accounts. Others derive from various kinds of bonuses that some carriers offer described above and in Chapter 3. Unfortunately, data on non-wage compensation are not readily available, and, as described later in this chapter, the data that are suitable for statistical analysis are crude measures, such as average starting wages at the carrier level.
Working Conditions
Duty Time Regulation
As described in more detail in Chapter 2, driver behavior is conditioned on federal hours of service (HOS) regulations and mandated use of electronic logging devices (ELDs) that took full effect in late 2018. HOS rules are designed to reduce crashes associated with fatigue by limiting the number of hours worked and providing opportunities for sleep and rest. Before the ELD mandate took effect, it was widely recognized that driver logbooks were easily and frequently completed in ways that misrepresented the actual hours drivers worked (Di Salvatore 1988; Viscelli 2016, Levy 2023). Even after the mandate, drivers can avoid reporting non-driving on-duty time to save time for driving (and earning) because the ELD only accounts for driving time (measured only while the vehicle is in motion) (Levy 2023). However, as shown later in this chapter, HOS violations have been reduced but persist.
Delivery Schedules
Drivers’ decisions about hours worked each day or week are influenced by non-compensation factors that are part of overall working conditions. Drivers may feel pressured by carriers (themselves feeling pressured by
___________________
10 See Chapter 3 for a discussion of non-wage rewards and benefits that some TL carriers provide to employee drivers.
shippers) to make deliveries on time even if they are fatigued; such pressure may lead to decisions to engage in unsafe driving behaviors, such as speeding, that can result in adverse safety performance. In contrast, carriers with positive safety cultures and policies for safe dispatching may have fewer fatigue-related crashes because they place less pressure on drivers to continue operating when too tired to drive safely. Larger carriers with broader customer bases have more options for assigning shipments to drivers, thereby reducing unpaid waiting times between shipments and allowing for more frequent nights at home. Schedule pressures on drivers are related to the hours within which drivers are allowed to work, as described next.
Uncompensated Time Worked
Drivers regularly encounter delays during their workdays, such as time detained at shipper and consignee docks.11 These delays count against drivers’ maximum 14 hours of on-duty time, but not against their maximum driving limit of up to 11 hours. The weekly limits designed to reduce fatigue, combined with piece-rate compensation, incentivize drivers to under-record on-duty time by recording detention time as off-duty. Most drivers earn pay only while driving, as pay for detention time is uncommon. If detention pay is provided, it can be in a lump sum to continue to incentivize the driver to reduce delays (Viscelli 2016). During the regular periods when carrier supply exceeds demand for shipments, carriers that may otherwise charge shippers for detention may waive these fees. In any case, detention time may contribute to incentives to drive the maximum hours allowed by HOS limits (and even to exceed them) and to engage in other unsafe driving behaviors, such as speeding. By prolonging drivers’ hours on duty, detention may contribute to fatigue and crash risk. Arguably, carriers establish their per-mile compensation rate at levels that carriers perceive adequate to compensate drivers for non-driving time worked, but drivers may be more focused on the opportunities to earn (by driving) to compensate for time lost while delayed.
Disrupted Sleep and Fatigue
Daily pressures and detention times are not the only potential contributors to driver fatigue that are derived from working conditions for truckload drivers. Several days or weeks on the road, combined with sleeping in a sleeper berth at different times and locations each night, can disrupt sleep
___________________
11 FMCSA’s major study on long-distance truck driver detention time is expected to be published in 2025. See www.fmcsa.dot.gov/research-and-analysis/impact-driver-detention-timesafety-and-operations.
and lead to chronic fatigue (Dingus et al. 2001). Both short nights of sleep and disrupted circadian rhythms can lead to chronic fatigue and impaired cognitive performance and reaction times (NASEM 2016). Importantly, working conditions may not be the sole source of fatigue if drivers do not, or are unable to, practice good sleep hygiene or if they do not receive sufficient rest when taking a 34-hour restart period.
Driver Health and Medications12
In addition to the adverse health effects of chronic fatigue, poor working conditions, such as the poor-quality food available at many truck stops (or driver choices for unhealthy food) and lack of opportunities for exercise, can have long-term adverse effects on drivers’ health for those who make a career of driving. Chronic fatigue due to inadequate sleep contributes to hypertension and heart disease. Drivers who become obese due to poor diets and lack of exercise can develop obstructive sleep apnea (OSA), which disrupts sleep and leads to fatigue, and which is also associated directly with crash risk if untreated. Medications taken for health conditions may reduce driver alertness to the surrounding hazards when driving. Fatigue is also a common side effect of blood pressure medications. Drivers who suffer from chronic fatigue and disrupted sleep may rely on illegal stimulants that can have adverse effects on their cognitive performance and judgment.
STUDY DATA AND METHODS
Existing studies of large truck safety fall into two principal types: (1) studies that rely on large databases of fatal crashes collected by the National Highway Traffic Safety Administration (NHTSA) and FMCSA crash records and (2) observational studies in which key measures are observed and analyzed for samples of drivers and carriers. Some studies using data from carriers are able to address “preventable crashes,” which are those in which a professional driver could and should have taken actions that would have avoided the crash (FMCSA 2009). In this section we provide a summary of these types of studies and their utility in responding to this study’s charge.
Studies Based on General Crash Data
Studies that rely on NHTSA crash databases have significant limitations relative to this committee’s charge. NHTSA’s primary data source collects data on all U.S. highway fatal crashes and fatalities, about which substantial
___________________
12 This overview relies on Soccolich et al. (2022) and other references provided in the section of this chapter on driver health.
information is collected and available. However, NHTSA does not gather information such as driver compensation, type of truck driver, or complete information about the truck involved in the crash. Relatively little comparable information is available for injury crashes, and even less about crashes that do not result in either injuries or fatalities. NHTSA data are useful for the estimates provided earlier in the chapter on the magnitude of the long-distance truck safety problem and trends, but it cannot be used to determine the causes of crashes or to isolate the role of compensation and working conditions on crashes.
FMCSA’s safety data rely on NHTSA data for aggregate information about fatal truck crashes but supplements this with additional information, as it does for injury and towaway crashes. FMCSA also collects extensive information from its roadside inspections of vehicles, citations of drivers for moving and HOS violations by inspectors and state police, and any truck-involved crash severe enough to require a vehicle to be towed away. Most of these data are aggregated at the carrier level and are increasingly relied on for the carrier-level observational studies discussed in the penultimate section of in this chapter. FMCSA, however, does not collect information about methods or levels of driver compensation and, aside from HOS violations, does not collect information from carriers about working conditions such as the hours and times that drivers work and are off duty, driver detention, or driver retention. Thus, the carrier-level studies reviewed later can compare safety outcomes across different carrier characteristics, but the influences on the behavior of drivers working for these firms must be inferred. FMCSA does collect information about driver violations and crashes while carriers, or their medical services contractors, collect information on the health conditions of drivers through the FMCSA medical examination requirements; these data have been drawn upon in the observational studies regarding driver health conditions and safety that are summarized later.
Observational Studies
Observational studies include a variety of analyses of crashes and drivers using data compiled from carriers or state or federal crash and FMCSA carrier safety records and other sources. The key feature of an observational study is observing what happens to outcomes of interest (e.g., crashes) without experimental control, that is, without random assignment to treatment and control conditions (e.g., pay by the hour versus pay by the mile). Most of the safety studies reviewed later are conducted at the driver-level, although an increasing number of carrier-level studies have appeared since FMCSA’s data have become available.
Naturalistic driving studies represent a novel form of observational study, compared to the more common methods applied to behavioral
highway safety studies. Naturalistic driving studies observe drivers and their vehicles while they are at work, rather than in a driving simulator in a laboratory setting. In naturalistic studies, several cameras are mounted, including facing the driver, to observe and record drivers, and what they can see around and behind them. Vehicle sensors detect and record how drivers control their vehicles, including staying within their driving lane, maintaining speed relative to conditions, and reacting to potential crash conditions. Through these studies, proxy measures of crash risk have been developed from driver behaviors such as hard steering or braking from near-crashes and crashes, which are referred to collectively as safety critical events (SCEs). SCEs provide useful surrogate measures of crash risk; they occur much more frequently than the most serious crashes recorded in federal safety databases and generate a sufficiently large sample for analysis at a lower cost than monitoring drivers and vehicles until an appropriate number of crashes have occurred (Guo et al. 2010).
During these studies, driver fatigue can be estimated from visual observation, such as the percentage or length of time eyelids are closed. In some naturalistic driving studies driver sleep is measured with actigraphs that monitor heart rate and movement to provide better estimates of actual sleep than available from driver recall. Naturalistic driving studies have been relied upon heavily by FMCSA in setting and refining HOS limits and for evaluating the effects of changes in these limits and are also relevant to this study’s charge regarding work condition effect on driver behavior and safety.
Observational studies of truck driver and carrier safety provide the available empirical evidence to address this study’s charge. However, as described next, the methods and data employed have inherent limits on determining cause-and-effect relationships.
Causal Analysis
To fully respond to the study charge, the key question is whether the method of TL driver compensation or working conditions affect safety outcomes. For the small number of long-distance TL drivers paid by the hour, their characteristics and working conditions are different enough (as discussed in Chapter 3) to confound a causal inference of any difference in safety outcomes due to compensation. Drivers at less-than-truckload (LTL) and private carriers, some of whom are paid by the hour, are more likely to drive local routes or regular regional delivery or pickup routes with regularly scheduled shifts and to return home most days, compared to the irregular routes and shifts common to long-haul, truckload driving. Driver self-selection could also be a confounding variable: drivers who dislike the working conditions in the truckload sector might trade higher income
for greater schedule regularity and ability to return home most nights or sleep in a hotel when a return trip the same day is impossible; these working conditions are more common in LTL and private carriage. Moreover, because multiple factors are associated with crashes (such as time of day, traffic levels, type roadway and its condition, and equipment condition), it is important to either limit the sample to situations in which the conditions are seemingly equivalent or to statistically adjust for the presence of the other conditions.
Randomized Controlled Trials
The best method for isolating the causal effects of compensation would be to compare the safety outcomes of two groups of drivers that are otherwise the same, but one group has a different form of compensation than the other. If long-distance TL drivers could be randomly assigned to one group paid by the mile (or other piece rate) and another group paid by the hour (or other non-piece-rate) and outcomes observed, and the two groups would be statistically equivalent except for method of pay, it would be possible to infer whether one method of TL driver compensation leads to different safety outcomes than the other. However, random assignment of drivers to different compensation methods would be difficult to accomplish. Indeed, no such study of commercial truck drivers exists.
Observational Studies
Many observational studies have been done that consider the safety effects of compensation, working conditions, or both. Most of the studies discussed below are based on cross-sectional surveys. The advantage of a cross-sectional study is that potential confounders that might change over time are controlled for. The disadvantage is loss of a dimension of variability (change over time) that might be informative. In addition, survey-based self-reports of fatigue, sleep, amount of driving (risk exposure), near-misses, and crashes may not be reliable. Of course, the main limitation of any observational study—whether purely cross-sectional or with a time series dimension—is the difficulty in controlling for confounders, many of which are unobserved.
The main studies of the effects of compensation on safety have relied on a single cohort study, a type of observational study with a longitudinal dimension, following over time a sample of drivers, often at a single large truckload firm. Cohort studies have the advantage of comparing behavior before and after a substantial increase in compensation but lack comparison groups. The several naturalistic driving studies cited in the next section are a form of cohort study, although the duration of such studies is short due
to the cost of instrumenting vehicles and monitoring drivers. They have an advantage over studies based on self-reports of fatigue and drowsy driving in that they carefully measure the effects of fatigue or sleep on proxy measures of safety. Naturalistic studies have the disadvantage of not having sufficient data to allow for valid comparisons and isolation of causal effects and not including representative samples of drivers.
A small number of observational studies rely on a case control approach, which compares drivers with crashes to seemingly similar matched drivers without crashes. The strength of inference about the role of compensation on behavior depends heavily on the quality of the matches, which is typically limited because of very incomplete data on which to match drivers with and without crashes.
In observational studies, regression models are frequently used with a measure of safety performance as the dependent variable, the treatment variable (e.g., a measure of compensation) as the primary explanatory variable of interest, and a variety of other factors included as controls. Data gathered through the types of observational studies described above are commonly analyzed using some form of regression adjustment. Building on the example provided above, both working conditions and compensation could serve as the primary explanatory variables of interest. The validity of this approach depends on how accurately and completely the other causal factors are measured and included, and on whether the relationships are properly modeled (NASEM 2016). Given that crashes often have multiple causes, one may be interested not only in the independent contribution of each causal factor but also in how they interact with each other. The widely relied upon regression methods establish only statistical associations among variables; they do not provide evidence of causality.
A 2016 National Academies report on driver fatigue and health suggested the use of several statistical techniques to strengthen causal inferences drawn from observational studies. Among the techniques suggested are propensity score methods, use of marginal structural models and multiple comparison groups, difference-in-difference estimation, and comparative interrupted time series designs (NASEM 2016, pp. 96–103). These recommended techniques mostly analyze and adjust results to attempt to account for possible observed and unobserved influences (confounders) that affect the outcome of interest and on which both the treatment group and comparison group are different.
The body of empirical driver-level studies reviewed next correlate compensation or working conditions with safety outcomes, based either on theories about economic behavior in the case of compensation or on theories from the behavioral and medical sciences about the effects on driver alertness of fatigue or inadequate sleep. Although some carrier-level studies reviewed later in this chapter apply some of the techniques recommended
in the fatigue study to enhance causal inference, driver-level studies have rarely done so, mainly because very few of these observational studies have adequate data for using the recommended techniques.
DRIVER-LEVEL STUDIES
The review of studies that follows examines evidence relating compensation to fatigue or directly to crashes without measuring fatigue. The second following section examines evidence relating working conditions to fatigue and unsafe driving behaviors.
Although some studies are stronger and more informative than others, the intent of this review is not to criticize specific studies. Rather, we seek to recognize the complexity of the problem to be addressed and the important and largely inherent limitations in attempting to study that problem. As explained in the earlier presentation of a conceptual framework, there are many proximate causes of crashes, and they will often interact to cause a crash. Moreover, as attention moves back from those proximate causes, it becomes clear that there are complex, intersecting paths from factors like the method of driver compensation, the driver’s experience, or the maintenance schedule for a truck to the proximate causes of crashes and, thereby, to the occurrence and severity of crashes. Along any such path, the effect of a factor might be substantially mitigated by the influences of other factors. All of this makes extraordinarily difficult the analysis of causal effects in nonexperimental studies of truck crashes and strongly limits what can be learned from such studies about causal effects. The studies cited below are selected because they have addressed some dimension(s) of the causal pathways among the variables called out in the study charge. Associations among variables are indicated and possible magnitudes of their effects are pointed out when they appear to be meaningful, while bearing in mind that each study addresses limited dimensions of the multiple influences on safety and lacks random assignment and comparison groups that would allow for causal inference.
Potential Causes of Driver Fatigue
Driver fatigue may result from behaviors such as working long hours induced by the incentives of compensation and the requirements of working conditions. Lack of opportunities for restorative sleep associated with working conditions, such as sleeping in berths while vehicles are in motion or at noisy truck stops and irregular work hours and sleep patterns, also cause fatigue (Dingus et al. 2001), as does the high prevalence of untreated obstructive sleep apnea among long-distance truck drivers (Mabry et al. 2022). The discussion that follows considers fatigue-inducing mechanisms
independently as they are addressed in or raised by individual studies, but these mechanisms are likely interrelated. That is, compensation incentives can cause fatigue independent of sleep and working conditions that reduce opportunities for restorative sleep can also cause fatigue.
Compensation Methods
Studies of the relationship between method of compensation and safety in U.S. long-distance TL driving are not feasible because the vast majority of driver are paid piece rate, usually by the mile or by the load. Some insights are available from Australian long-distance driving, given that the Australian industry pays both by the mile and by the hour. Compensation method was found to be associated with sources of fatigue for Australian long-distance truck drivers (Thompson and Stevenson 2014). Fatigue was not measured directly in this study but was assumed to be manifested by the number of hours worked. Piece-rate compensation methods were associated with longer hours worked than were other forms of compensation. This study, however, did not measure safety outcomes.
The remaining articles reviewed in this section include those that focus on per-mile compensation and, to a limited extent, fringe benefits. Empirical studies of the relationship between compensation and safety in the United States over the last two decades build on a report by Belzer et al. (2002). In their review of the preceding literature on the relationship between compensation and behaviors that affect safety, these authors found no conclusive evidence that linked compensation with measures of fatigue. Rather, their analyses attempted to link compensation directly with crashes and to provide evidence for the effect of piecework compensation on driver behavior, specifically hours worked and crash probability.
Belzer et al. (2002) conducted three separate analyses using different datasets. A summary of their cross-sectional, time-series analysis of carrier compensation packages and crashes (based on firm-level data) is included in the subsequent section on carrier-level studies. Their cross-sectional analysis of driver self-reports regarding compensation, hours worked, and crashes is covered later in this section. Their longitudinal cohort study of compensation and safety is discussed next.
Belzer et al. (2002, p. 6) hypothesize that (a) low rates of piecework compensation incentivize drivers to maximize hours worked in ways that encourage fatigue and to engage in unsafe driving behaviors and (b) high rates of piecework compensation incentivize drivers to drive fewer hours and to drive more safely to retain the higher compensation. They were able to test these hypotheses with 26 months of data on drivers, compensation, and crashes at a very large TL firm (J.B. Hunt). In early 1995, J.B. Hunt significantly increased wages (by 39% on average to eligible drivers) and
changed its hiring policies to reduce crashes and driver turnover.13 Thus, this action provided a natural experiment to test the impact of a pay raise on safety. Crashes in this study were any experienced by J.B. Hunt drivers that resulted in $200 or more in damage. The authors had driver data from J.B. Hunt for 13 months before the pay raise was announced and a 13-month period that began 5 months later when the pay raise was enacted (total period between September 1995 and March 1998). Their statistical analysis indicated that the higher per-mile rate paid to drivers after the pay increase was associated with an approximately 50 percent reduction in crashes in the 13-month period after the pay raise was enacted.
This finding could be interpreted as indicating that increased pay caused drivers to operate more safely, as Belzer et al. (2002) theorized. However, their main (“global”) model was unable to control for driver experience for all drivers already with J.B. Hunt before the wage increase was announced, as such data were not available. Before announcing the firm’s pay raise and associated changes in policy, J.B. Hunt typically hired drivers without experience, trained them on the job, and paid the low per-mile rates common for inexperienced drivers. The first year of driving a heavy truck has higher risk of crash rates and moving violations (Burks et al. 2016b, pp. 3 and 21), regardless of the age of the driver (Dunn et al. 2020, p. i). Belzer et al. (2002) recognized that the higher wage and other changes in corporate policy by J.B. Hunt attracted drivers who were more experienced and safer than the inexperienced drivers the firm typically hired before the announced wage increase. What remains unclear is whether the pay raise for the drivers who remained with the firm caused them to drive more safely or whether their crash risk was reduced by the additional experience gained during the entire 31-month period, or possibly by J.B. Hunt’s stated policy of retaining only the safest drivers among those hired before the announced pay increase, or any unobserved changes in policies or practices that might have influenced driver retention and behavior.
In a separate analysis, Belzer et al. (2002) analyzed cross-sectional data on randomly selected truck drivers interviewed in the University of Michigan Trucking Industry Program (UMTIP) Truck Driver Survey conducted in 1997–1998. Their model was based on 247 employee over-the-road drivers from the UMTIP survey paid by the mile and self-reports of mileage driven, crashes in the previous year, experience, and tenure with the drivers’ current firms. Compensation variables included pay for time worked while not
___________________
13 The pay raise was effectively an increase in the per-mile rate that J.B. Hunt paid to attract experienced drivers with characteristics that the carrier believed would increase safety—“union wages without the union” (Belzer and Sedo 2018). The carrier also screened applicants carefully for a variety of desired attributes, although these company-desired attributes were not documented.
driving, paid time off, health care, and safety and productivity bonuses. The results show an association between the compensation variables and reduced crashes. Monaco and Williams (2000), also using the UMTIP survey (based on 537 drivers in the survey), found that drivers paid by the hour were about 10 percent less likely to have a crash than drivers paid by the mile and that the likelihood that a driver paid by the mile would have a crash declined as the per-mile rate increased.
A key challenge in identifying a causal effect of truck driver compensation on safety is that the near universal use of piece-rate pay compensation for truck drivers in the long-distance TL sector (as discussed in Chapters 3 and 4) means that variance in driver-level pay across carriers is determined, in part, by differences in carrier-level productivity. Economic research indicates that quantity productivity is a powerful predictor of firm exit (Foster et al. 2008) and, therefore, of the ability of a struggling company to compensate workers at market rates. Moreover, because productivity is strongly linked to measures of management quality (Bloom et al. 2019), carrier-level quantity productivity may also affect safety through the mechanism of management practices, which seems likely given carrier management practices have been linked to safety (Miller 2020). Failure to account for these influences on compensation and safety in a cross-sectional regression model results in omitted variable bias that can attribute associations to variables included in the model instead of to those not included.
Belzer and Sedo (2018) reanalyzed the UMTIP data to estimate how pay rates affect self-reported average weekly hours worked, and, presumably, fatigue. Their 2018 article extends the labor/leisure theory that Belzer et al. (2002) hypothesized to determine whether drivers paid a higher rate per mile will work fewer hours; that is, whether they will trade labor for leisure. Although their fitted logistic model explains a small share of the variance, it suggests that at the highest level of compensation, workers reduce hours to conform to HOS regulations (about 60 hours weekly), which should reduce fatigue and enhance safety. However, at roughly 18 percent less pay per mile, drivers would be working roughly 70 hours per week.
Other evidence of drivers reducing hours worked as income increases comes from a survey of 1,249 long-haul truck drivers across four states, 87 percent of whom drove irregular routes (Braver et al. 1992). Braver et al. (1992) found that roughly three-quarters of drivers admitted to regularly violating HOS regulations. They also found that the odds of drivers violating these regulations declined about 20 percent as per mile rates of compensation increased from 21 cents per mile or less to 31 cents per mile or more (in 1992 dollars). ATA reported in 2021 that many long-distance TL drivers work less as wages rise (ATA 2021); a year later they stated “almost forty percent of truckload carriers reported to ATA that increases in pay
last year resulted in drivers choosing to drive less, make the same amount of money and be home more often” (ATA 2022).14
Compensation for Detention and Other Time Not Worked
As noted, truckload drivers are typically compensated for miles driven, but their total hours worked include time spent waiting for loading and unloading and completing paperwork. The detention time specifically called out in the study charge lacks a standard definition but is generally viewed in the industry as any waiting time beyond the normal two hours required for loading and unloading. In terms of prevalence, Dunn et al. (2014) estimate that 1 in 10 stops results in an average detention of 1.4 hours for all types of long-distance truck driving. TL drivers are more likely to experience detention than other types of long-distance drivers: The chances of being detained were nearly 5 times greater for TL drivers than private-carrier drivers and 2.6 times greater than for LTL drivers, according to Dunn et al. (2014).
The committee did not find driver-level empirical evidence directly linking detention with fatigue. However, studies cited in the next section on total hours worked, which would include detention and other forms of uncompensated time, do show associations between total hours on duty and various measures of fatigue-induced driver errors.
Working Conditions
Based on results from the 2010 National Institute for Occupational Safety and Health (NIOSH) survey, Chen et al. (2015) report that randomly selected drivers of long-distance trucks reported working 60 hours weekly on average, compared to 42 hours weekly for other general, full-time employees. TL drivers, 75 percent of the drivers in the NIOSH sample, averaged 65 hours of work per week (based on self-reports) (Kudo and Belzer 2019).
Many of the U.S. studies cited next regarding hours worked were conducted before ELDs were mandated. Hence, they may overstate current HOS violations and hours worked. FMCSA (2023) estimates HOS violations declined 35 percent from December 2017 (before the ELD mandate was in full effect) to after the ELD mandate was in full effect (FMCSA 2023). During the pre-mandate period, 1.17 percent of inspections had at least one HOS violation. In the December 2018 to December 2021 period, 0.77 precent of inspections had at least one HOS violation. However, as
___________________
14 As noted earlier, an experimental study showed that some bicycle couriers exhibit a “target income effect” in which they reduce effort after a piece-rate increase, but others do not. This cannot be directly extrapolated to truckers, but does suggest that driver responses to higher piece rates may not be uniform (Fehr and Goette 2007).
described in the section on carrier-level studies, HOS violations vary substantially across carriers of different sizes (from less than 2% of inspections for the largest carriers to about 6% of inspections for independent owner-operators after the ELD mandate was in effect) (Miller et al. 2020). Moreover, violations for speeding increased after the mandate took full effect, calling into question the net safety benefit of the mandate (Scott et al. 2020). Of relevance to this chapter, the ELD mandate may have reduced fatigue while also increasing the role of unsafe driving behaviors on safety, studies on which are reviewed in the main section that follows this one.
Hours worked. In the 1992 study of HOS violations cited earlier (Braver et al. 1992), three-quarters of the drivers reported regularly violating HOS limits and 19 percent of drivers admitted to falling asleep at the wheel one or more times in the previous month. The odds of being an HOS violator increased with total miles driven, days on the road per trip, and the assignment of unrealistic driving schedules one or more times in the preceding month.
McCartt et al. (2008) surveyed long-distance truck drivers at two weigh stations on rural Interstate highways in 2003, 2004, and 2005. The percentage of respondents across locations and time periods who were truckload drivers ranged from 71 to 81 percent. Drivers who reported dozing at the wheel in the preceding week were more than twice as likely to also report “often” or “sometimes” driving more than 11 hours per day (odds ratio [OR] of 2.18 [95% confidence interval (CI) = 1.58–2.99]). Similar ORs were estimated linking fatigue with a variety of HOS violations. In the 2010 NIOSH survey, 10 percent of drivers reported “often” and 27 percent “sometimes” violating HOS regulations (Chen et al. 2015). Lemke et al. (2021) surveyed U.S. commercial truck drivers and estimated reduced odds of HOS violations by drivers who drove less than 11 hours a day (OR = 0.37), a higher perception of supervisor support (OR = 0.17), and ever having told supervisor about being too tired to drive (OR = 0.42).
Studies based on driver self-reports of fatigue and near misses are subject to inaccuracies in driver recall for which naturalistic studies can correct by using extensive instrumentation of the vehicle. A naturalistic driving study by Blanco et al. (2011) showed that the risk of an SCE occurring (ORs) increased with driving hours, but with little difference across the 8th to 11th hours. However, for drivers who combined several hours of nondriving work with driving up to the limit of 14 hours of on-duty time, the risk of SCE occurrence increased with total time worked. By implication, estimates of driver risk of crash involvement would need to include both total driving time and total hours on duty to fully capture the effects of hours worked on fatigue.
In a case-control study, Jovanis et al. (2011) used driver logs and USDOT-reportable crashes from three TL carriers (878 drivers) and three LTL carriers (684 drivers) to estimate the odds of crashes occurring across hours driving and in relation to driving patterns, which included 7 consecutive days, time off-duty during the day, and hours of the day when driving and on-duty hours occurred. For LTL drivers, crash risk rose after the 5th hour. For all TL drivers, the hours of consecutive driving did not show an upward trend in crashes until a three-fold increase in risk in the 11th hour. However, for some shift patterns, crash risk increased in the 7th–11th hours.
Sleep and fatigue.
A substantial body of laboratory research has demonstrated that regular sleep of less than 7 hours daily reduces human performance (NASEM 2016, Chapter 3). Based on their review of the literature, Chen et al. (2016) conclude that lack of sleep is the main cause of fatigue or drowsiness among commercial drivers. Surveys of commercial truck drivers in other nations have found positive associations between commercial driver self-reports of short sleep and drowsy driving, near-misses, and crashes (Pertulla et al. 2011; Tseng et al. 2016; Kim et al. 2018; Mahajan et al. 2019a, 2019b). Only the Pertulla et al. (2011) study probed for nonwork-related causes of lack of sleep; in this study about half (53.2%) of drivers indicated that incidents of momentarily falling asleep while driving were unrelated to work.
Naturalistic driving studies (Mitler et al. 1997; Hanowski et al. 2007) have found that drivers receive less sleep on average than the 7 hours of sleep considered adequate (NASEM 2016). Drivers in the Hanowski et al. (2007) study, which measured sleep with actigraphs, received more than one hour of extra sleep (6.5 hours on average) than drivers in the Mitler et al. (1997) study. However, drivers in the Hanowski et al. (2007) study involved in at-fault safety critical incidents had substantially less sleep than their personal average (more than an hour less) in the preceding 24 hours before the incidents occurred (Hanowski et al. 2007).
Chen et al. (2016) found that the sleep pattern with the highest rate of SCEs “was associated with shorter sleep, sleep in the early stage of a non-work period, and less sleep between 1 a.m. and 5 a.m.” Liu et al. (2019) found that the rate of unintentional lane deviations increased after 8 hours of driving for drivers with less than 7 hours of sleep. Drivers with less than 7 hours of sleep took additional and longer breaks when they drove late into their allowable driving hours, but despite these additional breaks their rate of lane deviations was higher than for drivers with sufficient sleep.
Stevenson et al. (2013) conducted a case-control study of Australian long-distance truck drivers that included 530 drivers involved in non-fatal, non-severe crashes and 517 matched drivers not involved in crashes. The
two groups appear to be well matched on a variety of demographic, compensation, working conditions, and reported sleep measures, but there is no guarantee that the groups were well matched on unobservable influences that could affect crash probability. Driving between midnight and 6 a.m., a work period at variance with circadian rhythms, was associated with a three-fold higher risk of crashes. Driving without taking regular breaks was also associated with an elevated risk of crashes. In contrast to the naturalistic studies reviewed above, Stevenson et al. (2013) did not find an association between reported sleep and crashes. However, matched drivers’ estimates of the previous night of sleep reported at the time of the interview in the Stevenson et al. (2013) study may have been less subject to recall bias than drivers with crashes, who were not interviewed for as much as two weeks after their crashes and had incentives to misreport how much sleep they received before their crashes.
Driver health and medications.
Truckload working conditions are stressful, involve long hours, weeks away from home, irregular schedules, inadequate sleep, and lack of time or energy for exercise. These conditions all contribute to fatigue and adverse health outcomes, which also contribute to fatigue (NASEM 2016; Soccolich et al. 2022). Commercial motor vehicle drivers are twice as likely to be obese and have higher rates of obstructive sleep apnea (OSA), diabetes, metabolic syndrome, and high blood pressure as the general population (Soccolich et al. 2022).
Apostolopoulos et al. (2013) report the results of a Healthy Driver Survey of 316 long-haul truck drivers: the average age was 44.2 years and “83.4% were overweight/obese, 57.9% had sleeping disturbances, 56.3% fatigue, 42.3% musculoskeletal disorders, and about 40% had cardiovascular disease concerns.” Thiese et al. (2015) used Federal Motor Carrier Safety Administration (FMCSA) medical exams to estimate that in 2012 the average CMV driver was 44.1 years of age, obese (average body mass index [BMI] = 32.6 kg/m2), 8 precent had sleep apnea, 32.8 percent hypertension, 9 percent diabetes mellitus.15 Thiese et al. (2017) studied 38,184 drivers from a single large truckload motor carrier with data from 2005 to 2012. They employed FMCSA medical exams along with carrier crash records to develop a multivariate model that adjusted for demographic and anthropomorphic factors, as well as the speed at the crash. Using the FMCSA Medical Review Board’s multiple conditions matrix, they found that “drivers
___________________
15 Estimates from Thiese et al. (2015) were much lower for cardiovascular disease (4.5%) and musculoskeletal disorders (0.1%) than reported in the Healthy Driver Survey, perhaps reflecting a difference between what drivers felt comfortable telling a medical examiner who could disqualify them from driving compared to an interviewer promising anonymity.
with three or more medical conditions had significantly increased risk of preventable.”16 USDOT-reportable crashes (hazard ratio [HR] = 2.53, 95% CI = 1.65–3.88) and preventable crashes with injuries (HR = 2.23, 95% CI = 1.09–5.31) after adjustment for covariates.
Prescription and over-the-counter medications used to treat driver health conditions can also contribute to fatigue (Soccolich et al. 2022). In terms of prevalence, the LTCCS reports that 26.3 percent of large truck crashes were associated with truck driver prescription drug use and 17.3 percent with over-the-counter drug use. This level of medication may be associated with working conditions, but not necessarily with higher safety risk. Burks et al. (2016a), using 2,000 healthy drivers retrospectively matched to drivers with OSA on experience-at-hire and job tenure, all from a large truckload firm, and adjusting for other characteristics with a multivariate model, found that drivers accepting treatment were as safe as healthy ones, while those refusing treatment were 3.7 times (95% CI: 1.80, 8.00) more likely to have a preventable USDOT-reportable crash. However, this study was unable to separate the effects of treatment from other non-measured characteristics of those choosing or rejecting treatment. Hickman et al. (2020), using a case control methodology on more than 20,000 drivers, found that drivers aged 35 to 51 and treated for OSA, were 70 to 90 percent less likely to be involved in a preventable USDOT-reportable crash than matched drivers. They also found that drivers being treated for a medical condition were no riskier than drivers without a diagnosed medical condition. Soccolich et al. (2022, p. 3) estimate from other studies that about 7 to 8 percent of drivers have OSA and are being treated and another 6 percent of drivers are undiagnosed and therefore not being treated. Burks et al. (2020) conducted a cohort study of drivers at a single large truckload firm to estimate the costs to the firm of implementing an OSA program to diagnose and treat OSA. Using a difference-in-difference procedure to estimate health care costs for treatment and matched drivers, Burks et al. (2020) find cost savings for mandatory OSA treatment, which, when coupled with the likely societal cost savings from reduced crashes, could justify an FMCSA requirement that carriers implement such a program. Estimates of the numbers of CMV drivers not being treated for other adverse health conditions are not available.
___________________
16 Preventable crashes (also defined in the introduction to this chapter) is a broader category than “at fault”; they are crashes for which a professional driver could have and should have taken steps that would have avoided the crash (FMCSA 2009).
Summary
Regarding the effect of increased compensation on crashes, studies have shown associations between level of per mile pay and crashes, but whether higher pay makes drivers safer or, for example, simply attracts safer drivers, is unclear. The one study that has estimated whether higher pay induces drivers to reduce hours worked shows an association that could reduce fatigue, but the model explains only a very small percentage of the variance in hours worked and has other limitations. The remaining evidence for lower work intensity among employee drivers at higher wage rates cited by ATA above is limited. The safety improvement seen in studies linking compensation with safety might be down to hours of work rather than excessive speed or driver carelessness mediated by fatigue, but these studies have not accounted for possible changes in hours worked. Thus, the empirical evidence of a causal effect of compensation on fatigue and crashes is not persuasive.
The effects of detention on fatigue and safety have not been measured directly, but a naturalistic driving study found that higher rates of driver error were associated with total hours of paid and unpaid work time late in the total allowed 14 hours of on-duty driving time. Regarding working conditions that lead to long working days and weeks and fatigue, naturalistic studies also find associations between driver errors and total driving time within existing HOS limits.
Drivers across multiple surveys self-report increased drowsy driving due to inadequate sleep. Naturalistic studies also find that short sleep is associated with driver error. The one available case control study from Australia does not find an association between short sleep and crashes but its results may be compromised by driver recall bias. Laboratory studies, surveys, and naturalistic studies all provide evidence that fatigue due to long hours, inadequate sleep, or both, is associated with increased driver safety-critical errors. Whether these long hours and inadequate sleep and their effects on safety are caused by methods of compensation or industry working conditions or mitigated by other unobserved factors cannot be ascertained because of limitations in data and methods.
Potential Causes of Unsafe Driving Behaviors
As noted above, the 2006 LTCCS found (judgment-based) associations between crashes and driver behaviors such as driving too fast for conditions, following too closely, and aggressive driving. The association inferred in the LTCCS that directly related to working conditions was with drivers pressured to drive despite fatigue (3.2% of all truck crashes and 9.9% of two-vehicle crashes). Other studies have indicated that working conditions, such
as pressure to pick up and deliver loads on time, may contribute to unsafe driving behavior independent of fatigue. Beilock (1995 and 2003) estimated that 33 to 43 percent of long-distance drivers hauling produce or driving refrigerated trucks out of Florida would have to exceed posted speed limits to meet their indicated schedules if they complied with HOS limits. Chen et al. (2021) estimate that the 15 percent of long-distance heavy truck drivers in the 2010 NIOSH survey who report often receiving unrealistic delivery schedules were 7.5 times more likely than other drivers to often drive more than 10 mph over the speed limit. Marcus and Murray (2022) estimate elevated odds of drivers being involved in crashes for any driver convicted of various types of moving violations.17 The safety performance of drivers exceeding HOS regulations due to working conditions would presumably be reduced by fatigue, whose effects are summarized in the several studies cited in the previous section.
Driver Retention
The issue of driver retention is examined according to the study charge, presumably because of the expected association between experience and safety and concerns raised by the motor carrier industry about a shortage of drivers, as considered in the previous chapter. Prior studies have found that compensation packages, relationships of drivers with managers and dispatchers, and working conditions, among other reasons, are associated with driver willingness to stay with or leave a firm (Miller et al. 2000, Table 1). Higher driver turnover is associated with higher crash rates across both firms (Corsi and Fanara 1988) and drivers who change firms frequently, compared to those who do not (Staplin and Gish 2005). A more recent study of 12,038 drivers at a single large firm over a 3-year period indicated that drivers who stayed with the firm were 65 percent less likely to be involved in a FMCSA-reportable crash and 44 percent less likely to be cited for a moving violation than drivers who left voluntarily and without having had a crash in the preceding 7 days (Camden et al. 2020). A plausible argument can be made that driver familiarity with company policies, procedures, and working conditions contributed to the reduced number of crashes. However, the reasons that drivers remained with or left the firm were not investigated as part of this study and therefore not accounting for possible self-selection bias. It is also possible that drivers who stayed were inherently safer drivers. Even though drivers who stayed had similar ages
___________________
17 Examples include elevated odds of crash involvement for a speeding violation for more than 15 miles over the speed limit (1.25); failure to obey a traffic sign conviction (1.46); failure to obey warning light/flasher conviction (6.01); failure to use/improper signal conviction (1.94).
and BMIs of drivers who left voluntarily, data were not available for total driver experience. Only 25 percent of drivers remained with the firm over the 3-year period of the study. As explained in Chapter 5, endemic high turnover of drivers in the truckload sector stems from a number of possible reasons, but a central one appears to be the effect of the competitive structure of the industry on the wage-and-working-condition combinations provided by firms.
CARRIER-LEVEL ANALYSIS
Assuming the influence of compensation and working conditions is mediated through driver behavior, driver-level data would be preferable for addressing the study charge. However, analysts have also relied on carrier-level data to examine topics to seek insights into the effects of compensation and detention. This section reviews carrier-level analyses of (a) the associations between total compensation and safety using the National Survey of Driver Wages (NSDW); (b) the association between detention and safety; (c) associations between carrier safety and carrier size; and (d) associations between carrier safety and use of owner-operators as opposed to employee drivers. Of course, it is important to acknowledge at the outset that finding an association between compensation or other factors and safety performance at the carrier level does not imply that there is an association at the driver level. Also, as noted before, an association does not indicate that there is a causal effect.
Non-Wage Rewards
The carriers in NSDW are self-selected and generally much larger than the carriers in FMCSA’s datasets and are thus not representative of the industry (Ryley and Belzer 2023). However, the NSDW data are useful for understanding the association between compensation and safety for the carriers in this surveyed group. In their study of 1998 data, Belzer et al. (2002) report associations between firm level compensation data, including average pay rate for drivers with up to 3 years of experience, unpaid time, fringe benefits, bonuses, and paid time off, along with various control variables, and USDOT-reportable tow-away crashes for participating carriers in the same year. (The authors supplemented the information available in NSDW by surveying the carriers in their truckload subsample to gather data on whether the carriers in the NSDW group compensated drivers for detention and other un-paid on-duty time.)
Ryley and Belzer (2023) updated the analysis of the 1998 NSDW data with NSDW data from 2018 using similar statistical models, but somewhat different control variables. Their results using 2018 data are like the 1998
results, except that above average pay rates were positively associated with crashes. The authors speculate that this unexpected result may be because they did not have measures of unpaid work time for 2018 as used with 1998 data; they were unable to survey the firms in their sample to collect this data due to their non-disclosure agreement with the provider of NSDW.
Both the 2003 and 2023 analyses rely heavily on average starting mileage rates to represent the major component of compensation. The authors lack information about the mileage rates paid across all drivers. They are also unable to control for driver experience, which many other studies (e.g., Dunn et al. 2020) have found to be associated with safety. A lower average starting pay may be indicative of a carrier that has low productivity and an omitted variable problem, as discussed above. Even if that problem could be addressed, the interpretability of the results is questionable given the ecological fallacy, the error in thinking that a relationship observed for groups pertains to members of those groups. For example, a finding that carriers with higher compensation for drivers have better safety records does not imply that better-compensated drivers will have better safety records.
Driver Detention
USDOT’s Office of Inspector General (OIG) has used aggregated carrier-level data to estimate that crash risk increases by 6 percent for every 15-minute increase in detention (USDOT OIG 2018). However, the committee finds that there are several shortcomings in the USDOT OIG analysis. First, the base population data included carriers such as FedEx and UPS, which have high proportions of local delivery drivers, thereby distorting the results regarding the committee’s focus on long-distance truckload operations. Second, the report extrapolated detention time data from only 28 carriers in an industry with thousands of heterogeneous operating carriers, making the results non-representative. Third, the authors did not include control variables for carrier size in any of the crash models they used, which very likely overstates the impact of estimated periods of detention on safety. The academic literature (Miller et al. 2017) shows that carrier size is associated with crashes, making the reported statistic a likely overestimate. Finally, the report did not attempt to rule out alternative explanations for why detention time may be associated with crashes.
Carrier Strategic Management
Previous research using FMCSA databases has demonstrated that unsafe driving, HOS, and vehicle maintenance violations are negatively associated with carrier size (Scott and Nyaga 2019; Miller 2020; Scott et al. 2021; Balthrop et al. 2023). The results from prior research on these topics are
extended by original analysis for this study, the result of which are summarized in this section and detailed in Appendix B.
The firm-level data available from FMCSA allow for comparison of safety outcomes for different categories of carriers. However, because FMCSA does not collect information from carriers about rates of compensation, bonuses, fringe benefits, and non-wage rewards, it is not possible to control for variation in compensation rates or packages when comparing carriers using FMCSA data. Nor is it possible to control for driver characteristics that are important determinants of safety, such as driver experience, because FMCSA does not collect information from carriers about individual driver demographic or other characteristics. Despite these serious limitations, a focus on carrier size points to the potential importance of carrier management policies, since large carriers have been found to have lower rates of safety violations and crashes compared with other carriers, despite their higher rates of driver turnover and reliance on piece-rate compensation (Miller et al. 2017).
Context
Safety, HOS, and vehicle maintenance violation rates vary considerably across carrier characteristics, as illustrated by the trends in carrier HOS violations by fleet size shown in Figure 5-4. These trends in HOS violations compare carriers of different sizes before the ELD mandate took effect, after light enforcement began, and after strict enforcement began. Also included is a comparison group of carriers that had already adopted use of ELD devices before the FMCSA mandate. Note that 1-truck carriers (owner-operators operating under their own authority) had HOS violation rates of roughly 11 percent per inspection before enforcement yet continued to have rates of roughly 6 percent after the mandate took effect; carriers with 21-100 trucks had HOS violation rates per inspection above 5 percent before the mandate that declined to between 2 and 3 percent afterward; and the largest carriers had HOS violation rates between 1 to 2 percent per inspection before the mandate, which dropped to the low end of that range after enforcement began.
Carrier-Level Analyses of Violations and Safety
The limited academic research that has examined for-hire owner-operators has contrasted these individuals’ compliance with safety rules with that of larger carriers that use either leased-on owner-operators or employee drivers. Balthropt et al. (2023, Table 3), report that for 2012–2016, for-hire
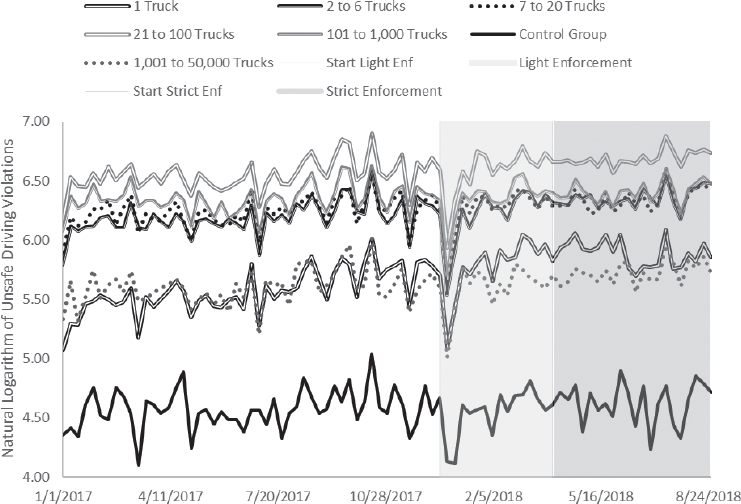
SOURCE: Scott et al. 2020.
owner-operators had driver violation rates18 that were 2.45 standard deviations larger than drivers operating trucks for carriers with 1,000 or more power units. Likewise, they report that for-hire owner-operators had vehicle-related violation rates that were 1.85 standard deviations larger than drivers operating trucks for carriers with 1,000 or more power units. Using data from 2012 to 2015, when spot market freight rates were higher, Scott and Nyaga (2019) document that for-hire owner-operators were more likely to be cited than carriers with employee drivers for serious hours-of-service violations. They further report that for-hire owner-operators were especially likely to violate hours-of-service rules relative to large carriers with employees when spot market rates for dry van truckload shipments were high. As noted above in Figure 5-4, Scott et al. (2020) document that for-hire owner-operators saw a far more substantial reduction in serious hours-of-service
___________________
18 Driver violations cover both unsafe driving violations (e.g., speeding) as well as hours-over-service violations. Some violations, such as speeding or improper lane changes, may be discovered by patrolling law enforcement officers. Others, such as hours of service or unsafe equipment violations, are more likely to be discovered at inspections, which can occur at truck weigh stations or during announced inspection blitzes.
violations following the onset of the electronic logging device (ELD) mandate than did larger carriers. Because independent owner-operators differ from other drivers and larger carriers in many ways, the findings from these analyses, while consistent with economic theory (see Chapters 3 and 4), do not establish that being an independent owner-operator alone causes a driver to violate safety rules more frequently.
To date, much of the research concerning leased-on owner-operators has sought to contrast how the composition of large carriers’ fleets (employee drivers versus leased-on owner-operators) affects various dimensions of safety compliance. Miller et al. (2018), using data from 2012–2014, report that carriers with a greater proportion of their power units operated by leased-on owner-operators have higher rates of citations for unsafe driving behaviors, hours-of-service violations, and vehicle maintenance issues. They further report that the evidence of increase was statistically stronger for both hours-of-service violations and vehicle maintenance issues than it was for unsafe driving behaviors. Miller et al. (2022), using data from 2010–2013, report carriers with a greater proportion of their power units operated by leased-on owner-operators saw slower rates of improvement in hours-of-service violation rates and vehicle maintenance violation rates following FMCSA’s rollout of the Compliance, Safety, and Accountability (CSA) program in late 2010.
The analysis described in the next section provides additional evidence of higher rates of violations among carriers that rely heavily on leased-on owner-operators, although it also points out that such carriers do not have higher rates of crashes. While the violation evidence aligns with a theory that owner-operators have stronger incentives from piece-rate compensation than employee drivers, it is important to keep in mind that the results discussed above and presented below are only correlations. While the estimated statistical models sought to hold constant a wide range of factors, some variables such as use of formal management practices and carrier-level productivity are not held constant because they are unobserved. To the extent these omitted factors may be correlated with carriers’ use of leased-on owner-operators as well as being correlated with safety outcomes, the results will fail to capture causal relationships correctly.
New Analysis Results
In Appendix B, a statistical analysis is provided of 1,365 carriers with 100 or more power units which tracks these carriers’ safety performance over a 14-year period. Roughly 96 percent of the carriers in this sample are TL carriers, while the others are mostly LTL carriers. Controls for carrier type were included in the analyses to attempt to mitigate any impact this small percentage of LTL carriers might have on the results. Safety performance
metrics for each carrier were provided by FMCSA; they include Unsafe Driving Violations, Hours-of-Service Violations, Vehicle Maintenance Violations, Fatal Crashes, Injury Crashes, and Towaway Crashes. Statistical techniques are used to allow interpretation of the counts of violations and crashes as rates. The details of the statistical analysis are explained in Appendix B.
As shown in Figure B-1 of Appendix B, the intraclass correlations for unsafe driving, vehicle maintenance, and crash metrics all exceed 0.70. These correlations indicate that carrier differences on these measures are stable over time. That is, the rank order of carriers on these variables does not change dramatically from year to year. The consistency for the crash metrics argues against the possibility that this pattern of crashes occurred by chance.
The analysis examines how the safety metrics are associated with both carrier size and carrier reliance on leased-on owner-operators, controlling for other observed carrier characteristics. Most carriers use leased-on owner-operators on occasion, but heavier carrier reliance on leased-on owner-operators versus employee drivers as a business strategy is almost always either one or the other as illustrated in Figure B-2 in Appendix B.
The analysis of carrier reliance on leased-on owner-operators (Figure B-3 in Appendix B) indicates that such reliance has a negligible association with unsafe driving violations and crashes but does have a stronger association with HOS and maintenance violations. The reasons why this pattern is not consistent across all the violation and crash metrics cannot be explained with available data. In contrast, the analysis of carrier size does show a consistent set of negative correlations with safety metrics (Figure B-4 in Appendix B).
As described in Appendix B, unsafe driving, HOS, and vehicle maintenance violations are positively associated with crashes, and the association is larger for driving violations than for the other two types of violations (Figures B-6 and B-7 in Appendix B). Although these findings are subject to the previously discussed limitations and do not support causal conclusions, they suggest that carriers might be able to reduce crash rates by reducing unsafe driving violations, HOS violations, and maintenance violations. Camden et al. (2022) conducted initial case studies of 9 carriers, ranging in size from 50 to more than 1,000 power units, and found that these carriers had adopted an array of policies and strategies to improve safety (reductions in FMCSA reportable crashes, safety violation rates, and other indicators).
SUMMARY POINTS
The committee offers findings below on specific items in the study’s charge regarding associations among compensation, non-wage rewards, retention, detention, working conditions, driver behavior and safety.
- More evidence is available about the associations between long-distance truckload working conditions, primarily through fatigue and inadequate sleep, and safety than for the associations between compensation, retention, or detention and safety. However, economic incentives and working conditions are tightly coupled in the truckload sector of the industry, thereby making it plausible that their interdependent effects are associated with safety. That said, association is not proof of causality and does not establish that any causal effects that might exist would be practically meaningful.
- A meaningful assessment of the effects of compensation methods (per mile versus per hour) on long-distance truck driver safety, as requested in the study charge, is not feasible with available data.
- The study charge calls for the committee to determine whether there are relationships among compensation methods, driver retention, driving behaviors, and safety performance, including how other factors, such as non-wage rewards, detention and other working conditions may have a bearing on these relationships. Although there is evidence that fatigue affects safety, there is no convincing evidence that compensation (method or level) causes fatigue. Indeed, aside from a likely causal relationship between working conditions and fatigue, the committee has not found convincing empirical evidence that any of the other factors identified in the study charge affect safety.
- The fundamental problem is that available data are not amenable to producing evidence to support causal conclusions. The problems include having no data source pulling together all the key safety outcomes, driver characteristics, carrier characteristics, and so forth; very limited variability in the method by which long-distance truck drivers are paid; and even if the first two limitations were somehow overcome, strong selection mechanisms based on unobservable driver and carrier characteristics that would confound analyses of causal effects. Moreover, as noted in Chapter 4, multiple forms of piece-rate compensation and benefits exist within the long-distance truckload sector that could influence driver behavior, but—aside from whether a driver is an independent or leased-on owner-operator versus an employee driver-data—are not available at the driver level regarding these different forms of compensation or, even, the total compensation drivers receive.
- The carrier-level analyses at the end of this chapter point to a negative association (meaning the larger the carrier the lower the likelihood for crashes) between carrier size and safety measured by safety metrics including unsafe driving violations, HOS violations, maintenance violations, and crashes. This association exists despite larger truckload carriers having higher rates of driver turnover. Such an association does not mean that all large carriers have better safety performance or that size itself has anything to do with their better average safety performance. However, it is possible that some large carriers have been able to reduce crashes by adopting management and other practices to reduce safety violations. Initial case studies of a small set of carriers with 50 or more power units finds that these carriers employed a wide array of policies and strategies to substantially improve their safety performance. Ideas on possible further research to determine the carrier strategies and policies that are most effective in enhancing safety are provided in Chapter 7.
REFERENCES
American Trucking Associations, Economics Department. (2021). Driver shortage update 2021.
American Trucking Associations, Economics Department. (2022). Driver shortage update 2022.
Apostolopoulos, Y., Sonmez, S., Shattell, M. M., Gonzales, C., and Fehrenbacher, C. (2013). Health survey of U.S. long-haul truck drivers: Work environment, physical health, and healthcare access. Work, 46(1), 113–123.
Balthrop, A., Scott, A., et al. (2023). How do trucking companies respond to announced versus unannounced safety crackdowns? The case of government inspection blitzes. Journal of Business Logistics, 44(4), 641–665.
Beilock, R. (1995). Are truckers forced to speed? Logistics and Transportation Review, 21(3).
Beilock, R. (2003). Schedule tightness among tractor-trailer drivers. Accident Analysis and Prevention, 4(2).
Belzer, M., and Sedo, S. (2018). Why do long distance truck drivers work extremely long hours? The Economic and Labor Relations Review, 29(1).
Belzer, M., Rodriguez, D., and Sedo, S. (2002). Paying for safety: An economic analysis of the effect of pay on truck driver safety. Federal Highway Administration/Federal Motor Carrier Safety Administration.
Blanco, M., Hanowski, R. J., Olson, R. L., Morgan, J. F., Soccolich, S. A., Wu, S.-C., and Guo, F. (2011). The impact of driving, non-driving work, and rest breaks on driving performance in commercial motor vehicle operations. FMCSA-RRR-11-017. Federal Motor Carrier Safety Administration, U.S. Department of Transportation.
Bloom, N., Brynjolfsson, E., Foster, L., Jarmin, R., Patnaik, M., Saporta-Eksten, I., and Van Reenen, J. (2019). What drives differences in management practices? American Economic Review, 109(5), 1648–1683.
Burks, S., et al. (2020). Employer-mandated obstructive sleep apnea treatment and healthcare cost savings among truckers. Sleep, 43(4).
Burks, S. V., Anderson, J. E., et al. (2016a). Nonadherence with employer-mandated sleep apnea treatment and increased risk of serious truck crashes. Sleep, 39(5), 967–975.
Burks, S. V., Anderson, J. E., et al. (2016b). Supplementary material to nonadherence with employer-mandated sleep apnea treatment and increased risk of serious truck crashes. Sleep, 39, 967–975. https://doi.org/10.5665/sleep.5734.
Camden, M., Soccolich, S., Hickman, J., Walker, M., and Hanowski, R. (2020). Examining the relationship between CMV driver retention and safety. National Surface Transportation Safety Center for Excellence.
Camden, M., Hickman, J., and Hanowski, R. (2022). Reversing poor safety records: Identifying best practices to improve fleet safety. Safety, 8(2). https://doi.org/10.3390/safety8010002.
Chen, G., et al. (2015). NIOSH National Survey of Long-Haul Truck Drivers: Injury and safety. Accident Analysis and Prevention.
Chen, G., et al. (2021). Truck driver reported unrealistically tight delivery schedules linked to their opinions of speed limits and hours-of-service rules and their compliance with these safety laws and regulations. Safety Science, 133.
Chen, G., Fang, Y., Guo, F., and Hanowski, R. (2016). The influence of daily sleep patterns of commercial truck drivers on driving performance. Accident Analysis and Prevention, 91, 55–63. https://doi.org/10.1016/j.aap.2016.02.027.
Corsi, T. M., and Fanara, Jr., P. (1988). Driver management policies and motor carrier safety. The Logistics and Transportation Review, 24, 153–163.
Di Salvatore, B. (1988). A reporter at large: Large cars—Part II. The New Yorker, 64(31), 63(22).
Dingus, T., et al. (2001). Impact of sleeper berth on driver fatigue: Final report. Virginia Tech Transportation Institute. https://vtechworks.lib.vt.edu/server/api/core/bitstreams/f6bab820-7584-4b74-a7a5-5510e2dc36fc/content.
Dunn, N., et al. (2014). Driver detention times in motor carrier safety. Federal Motor Carrier Safety Administration, U.S. Department of Transportation.
Dunn, N., Soccolich, S., and Hickman, J. (2020). Commercial motor vehicle driver risk based on age and driving experience. Transportation Safety Center for Excellence.
Federal Motor Carrier Safety Administration (FMCSA). (2009). A guide to determining preventability of accidents: A motor carrier’s guide to improving highway safety. Federal Motor Carrier Safety Administration, U.S. Department of Transportation.
Federal Motor Carrier Safety Administration (FMCSA). (2020a). Large truck and bus crash facts. Federal Motor Carrier Safety Administration, U.S. Department of Transportation. https://www.fmcsa.dot.gov/sites/fmcsa.dot.gov/files/2022-10/LTBCF%202020-v5_FINAL-09-20-2022%20508%2010-3.pdf.
Federal Motor Carrier Safety Administration (FMCSA). (2020b). Commercial driver safety risk factors (CDSRF). FMCSA-RRR-17-014. Federal Motor Carrier Safety Administration, U.S. Department of Transportation.
Federal Motor Carrier Safety Administration (FMCSA). (2022). Pocket guide to large truck and bus statistics, Table 4-22. https://www.fmcsa.dot.gov/sites/fmcsa.dot.gov/files/2023-02/FMCSA%20Pocket%20Guide%202022-FINAL%20508%20121922.pdf.
Federal Motor Carrier Safety Administration (FMCSA). (2023). The electronic logging devices oversight report to Congress pursuant to Section 23017 of the Infrastructure Investment and Jobs Act (Pub. L. 117-58).
Guo, F., Klauer, S., Hankey, J., and Dingus, T. (2010). Near crashes as crash surrogates for naturalistic driving studies. Transportation Research Record, 2147.
Kim, D., et al. (2018). Sleep status and the risk factor of drowsy-related accidents in commercial motor vehicle drivers. Sleep Medicine Research, 9(2), 97–103.
Kudo, T., and Belzer, M. (2019). The association between truck driver compensation and safety performance. Safety Science, 120.
Lemke, M., et al. (2021). Hours-of-service compliance and safety outcomes among long-haul truck drivers. Transportation Research Part F: Traffic Psychology and Behavior, 76.
Levy, K. E. C. (2015). The contexts of control: Information, power, and truck-driving work. Information Society, 31(2), 160–174.
Levy, K. (2023). Data driven: Truckers, technology, and the new workplace surveillance. Princeton University Press.
Mabry, J. E., Camden, M., Miller, A., Sarkar, A., Manke, A., Ridgeway, C., Iridiastadi, H., Crowder, T., Islam, M., Soccolich, S., et al. (2022). Unravelling the complexity of irregular shiftwork, fatigue and sleep health for commercial drivers and the associated implications for roadway safety. International Journal for Environmental Research and Public Health, 19, 14780. https://doi.org/10.3390/ijerph192214780.
Mahajan, K., Velaga, N., Kuma, A., and Choudhary, P. (2019a). Effects of driver sleepiness and fatigue on violations among truck drivers in India. International Journal of Injury Control and Safety Promotion, 26(4), 412–422.
Mahajan, K., Velaga, N., Kuma, A., Choudhary, P., and Choudhary, P. (2019b). Effects of driver work-rest patterns, lifestyle and payment incentives on long-haul truck driver sleepiness. Transportation Research Part F: Traffic Psychology and Behavior, 60, 366–382.
Marcus, A., and Murray, D. (2022). Predicting truck crash involvement: 2022 update. American Transportation Research Institute, Arlington, VA.
McCartt, A., Hellinga, L., and Solomon, M. (2008). Work schedules of long-distance truck drivers before and after 2004 hours-of-service rule change. Traffic Injury Prevention, 9.
Miller, J. W., and Kulpa, T. (2022). Econometrics and archival data: Reflections for purchasing and supply management (PSM) research. Journal of Purchasing and Supply Management, 28(3), 100780.
Miller, J. W., and Saldanha, J. P. (2016). A new look at the longitudinal relationship between motor carrier financial performance and safety. Journal of Business Logistics, 37(3), 284–306.
Miller, J. W., Golicic, S. L., et al. (2018). Reconciling alternative theories for the safety of owner–operators. Journal of Business Logistics, 39(2), 101–122.
Miller, J. W., Bolumole, Y., and Schwieterman, M. A. (2020). Electronic logging device compliance of small and medium size motor carriers prior to the December 18, 2017, mandate. Journal of Business Logistics, 41(1), 67–85.
Miller, J., Skowronski, K., et al. (2022). Asset ownership and incentives to undertake non-contractible actions: The case of trucking. Journal of Supply Chain Management, 58(1), 65–91.
Mitler, M. M., Miller, J. C., Lipsitz, J. J., Walsh, J. K., and Wylie, C. D. (1997). The sleep of long-haul truck drivers. New England Journal of Medicine, 337, 755–761.
Monaco, K., and Williams, E. (2000). Assessing the determinants of safety in the trucking industry. Journal of Transportation and Statistics.
Motor Carrier Safety Improvement Act of 1999, Public Law 106-159, 113 Statute 1748, Dec. 9, 1–26.
National Academies of Sciences, Engineering, and Medicine (NASEM). (2016). Commercial motor vehicle driver fatigue, long-term health, and highway safety: Research needs. The National Academies Press. https://doi.org/10.17226/21921.
Scott, A., and Nyaga, G. N. (2019). The effect of firm size, asset ownership, and market prices on regulatory violations. Journal of Operations Management, 65(7), 685–709.
Scott, A., Balthrop, A., and Miller, J. (2020). Unintended responses to IT-enabled monitoring: The case of the electronic logging device mandate. Journal of Operations Management.
Soccolich, S., et al. (2022). Challenges of conducting empirical epidemiological research with truck and bus drivers in diverse settings in North America. International Journal of Environmental Research and Public Health, 19.
Staplin, L., and Gish, K. W. (2005). Job change rate as a crash predictor for interstate truck drivers. Accident Analysis and Prevention, 37, 1035–1039.
Stevenson, M. R., Elkington, J., Sharwood, L., et al. (2014). The role of sleepiness, sleep disorders, and the work environment on heavy-vehicle crashes in 2 Australian states. American Journal of Epidemiology, 179(5), 594–601. https://doi.org/10.1093/aje/kwt305.
Thiese, M. S., Moffitt, G., Hanowski, R. J., Kales, S. N., Porter, R. J., and Hegmann, K. T. (2015). Repeated cross-sectional assessment of commercial truck driver health. Journal of Occupational and Environmental Medicine, 57, 1022–1027.
Thiese, M. S., Moffitt, G., Hanowski, R. J., Kales, S. N., Porter, R. J., and Hegmann, K. T. (2017). Multiple conditions increase preventable crash risks among truck drivers in a cohort study. Journal of Occupational and Environmental Medicine, 59, 205–211.
Thompson, J., and Stevenson, M. (2014). Associations between heavy-vehicle driver compensation methods, fatigue-related driving behavior, and sleepiness. Traffic Injury Prevention, 15. https://www.tandfonline.com/doi/full/10.1080/15389588.2014.928702.
Tseng, C.-M., Yeh, M.-S., Tseng, L.-Y., Liu, H.-H., and Lee, M.-C. (2016). A comprehensive analysis of factors leading to speeding offenses among large-truck drivers. Transportation Research Part F: Traffic Psychology and Behaviour, 38, 171–181. https://doi.org/10.1016/j.trf.2016.02.007.
U.S. Department of Transportation (USDOT). (2006). Large truck crash causation study: Report to Congress.
U.S. Department of Transportation Office of Inspector General (USDOT OIG). (2018). Estimates show commercial driver detention increases crash risks and costs, but current data limit further analysis. Report No. ST2018019.
Viscelli, S. (2016). The big rig: Trucking and the decline of the American dream. University of California Press.
This page intentionally left blank.


